
Beschreibung
Hinweis: Getestet nur auf cTrader Windows.
Volumenprofil
Ein vertikales Profil, das im Kursdiagramm gezeichnet wird, um zu zeigen, bei welchem Preis mehr/weniger Volumen (Handelsinteresse) vorhanden ist.
Der Flexible Volume Profile Indikator
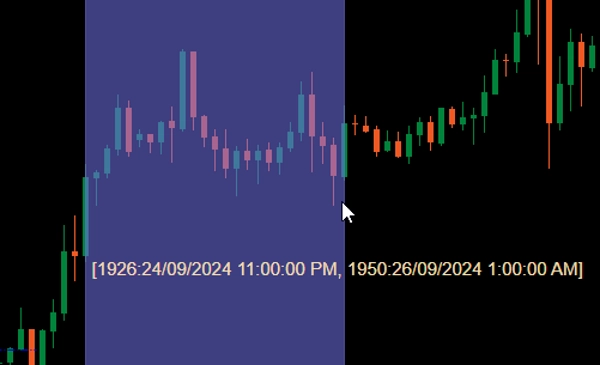
Wenn Sie ihn zu Ihrem Chart hinzufügen, ziehen Sie mit gedrückter Strg-Taste die linke Maustaste über einen Bereich im Kursdiagramm, um für diesen Bereich ein Profil zu zeichnen.
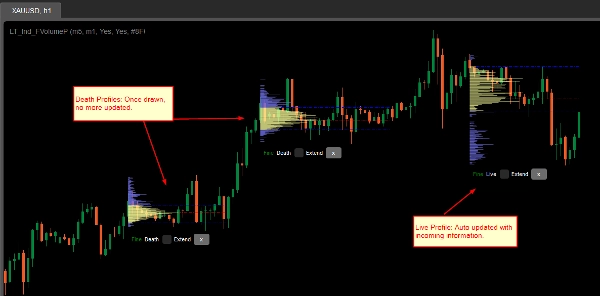
Aus Leistungsgründen wird das Profil in 2 Zuständen gezeichnet:
- Grobes Profil: Der Indikator verwendet den durch CoarseTF definierten Zeitrahmen (Standard m5), um Volumeninformationen zu laden, dies ist normalerweise schnell. Während das grobe Profil angezeigt wird, wird das feine Profil im Hintergrund geladen.
- Feines Profil: Präziseres Profil, das den durch FineTF definierten Zeitrahmen verwendet (Standard m1), aber Sie können es auf feinste Einstellung (t1 - einzelner Tick) setzen. Wenn Sie jedoch ein Tages- oder längeres Zeitrahmendiagramm betrachten, erhöht die Einstellung auf Tick-Zeitrahmen die Ladezeit.
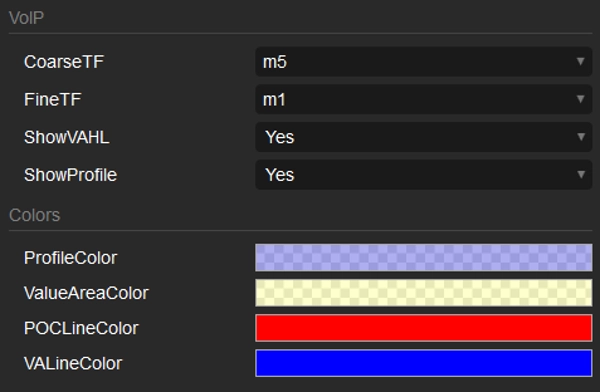
Parameter
- CoarseTF: Zeitrahmen für grobe Daten (Standard m5).
- FineTF: Zeitrahmen für feine Daten (Standard m1).
- ShowVAHL: Zeigt VAH (Value Area High) und VAL (Value Area Low) an.
- ShowProfile: Wenn Ja, wird das vollständige Profil angezeigt, andernfalls nur VAH, VAL und POC (Point of Control).
- Farben: Farb-Anpassung.
Anwendung
Nachdem Sie den Indikator zu Ihrem Kursdiagramm hinzugefügt haben, verwenden Sie einen Strg-Linksklick und ziehen, um den Bereich im Diagramm auszuwählen, den Sie profilieren möchten, und das war's.
Nachdem das Profil gerendert wurde, sehen Sie einige Informationen/Bedienelemente am unteren Rand des Profils:
- Groß/Fein: Status des Profils.
- Tot/Lebendig: Wenn Ihr Profil die neueste Kerze (Bar) abdeckt, ist es ein lebendiges Profil und wird automatisch mit eingehenden Informationen aktualisiert.
- Erweitern-Checkbox: Aktivieren, um die VAH-, VAL- und POC-Linien bis zur neuesten Kerze (Bar) zu verlängern.
- x-Schaltfläche: Klicken, um das Profil aus dem Diagramm zu entfernen.
Zusammenfassung
Users activate the profile by holding Ctrl and dragging the mouse over a desired chart region. The indicator operates in two modes for performance optimization: a Coarse profile using a configurable timeframe (default 5 minutes) for faster loading, and a Fine profile using a finer timeframe (default 1 minute, with an option down to single ticks) for more precise volume data.
Key parameters include:
- CoarseTF and FineTF: timeframes for coarse and fine volume data aggregation.
- ShowVAHL: toggles display of Value Area High (VAH) and Value Area Low (VAL).
- ShowProfile: controls whether the full profile or only key levels (VAH, VAL, Point of Control) are shown.
- Colors: customizable color settings.
After rendering, the profile provides status indicators (Coarse/Fine, Live/Dead), options to extend VAH, VAL, and POC lines to the latest bar, and the ability to remove the profile. This tool supports detailed volume analysis to assist traders in identifying significant price levels based on traded volume.
Kundenbewertungen
5 | 100 % | |
4 | 0 % | |
3 | 0 % | |
2 | 0 % | |
1 | 0 % |


