present
Registrieren Sie sich und erhalten Sie $50 Rabatt auf Ihren ersten Kauf
Trading product for Nubes_CTrader Indikator EMA Supertrend, image 1
Nubes_CTrader
Indikator
2 kÀufe
Version 1.0, Jun 2026
Windows, Mac
Trading product for Nubes_CTrader Indikator EMA Supertrend, image 2
Trading product for Nubes_CTrader Indikator EMA Supertrend, image 3
Trading product for Nubes_CTrader Indikator EMA Supertrend, image 4
Trading product for Nubes_CTrader Indikator EMA Supertrend, image 5
Seit 10/03/2026
2
VerkÀufe

Beschreibung

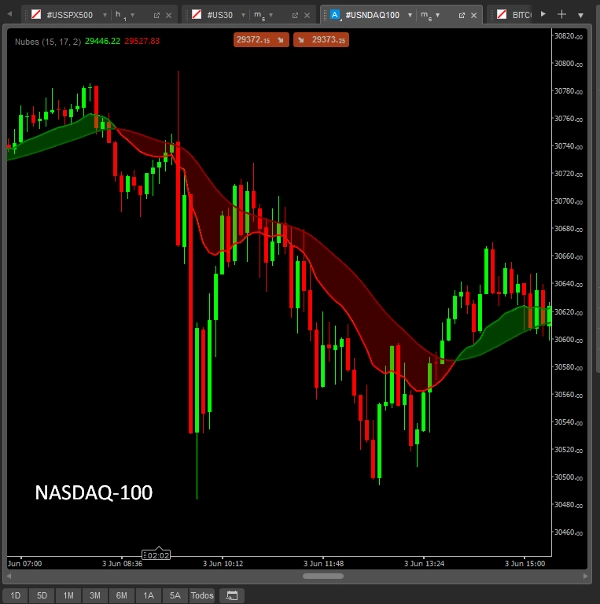
Dual Moving Average Trend Cloud Indikator fĂŒr cTrader

Halten Sie Ihren Handel im Einklang mit dem institutionellen Trend. Der Dual Moving Average Trend Cloud Indikator ist ein fortschrittliches visuelles Werkzeug, das entwickelt wurde, um die makroökonomische Marktrichtung zu identifizieren und Zonen mit hoher Wahrscheinlichkeit fĂŒr Pullback- oder Fortsetzungseinstiege zu erkennen.

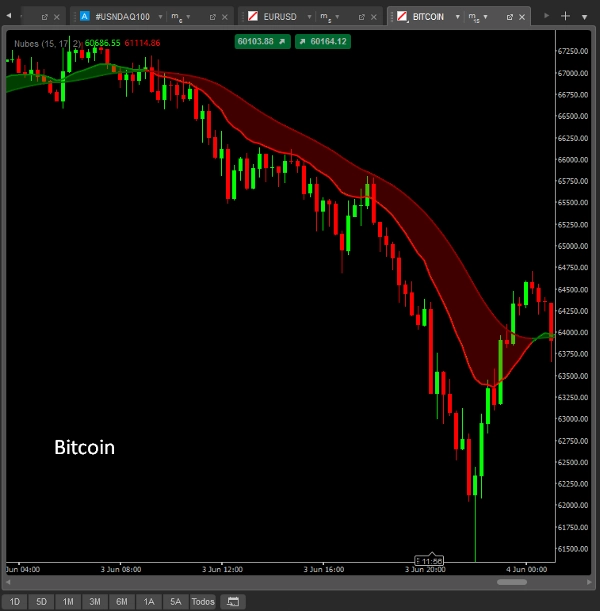
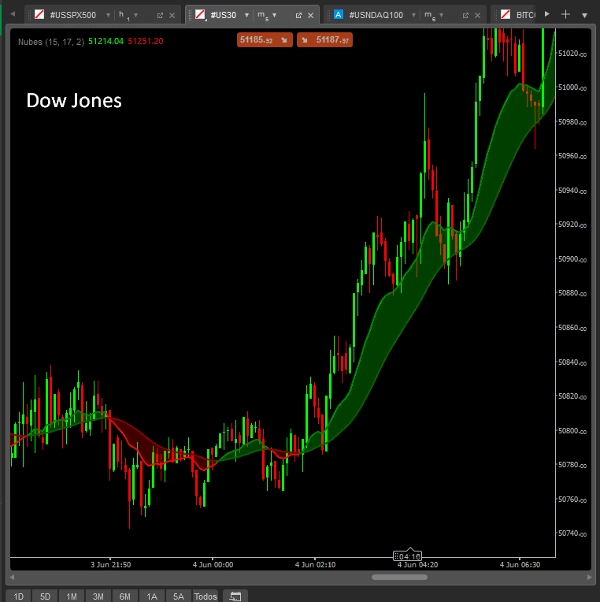
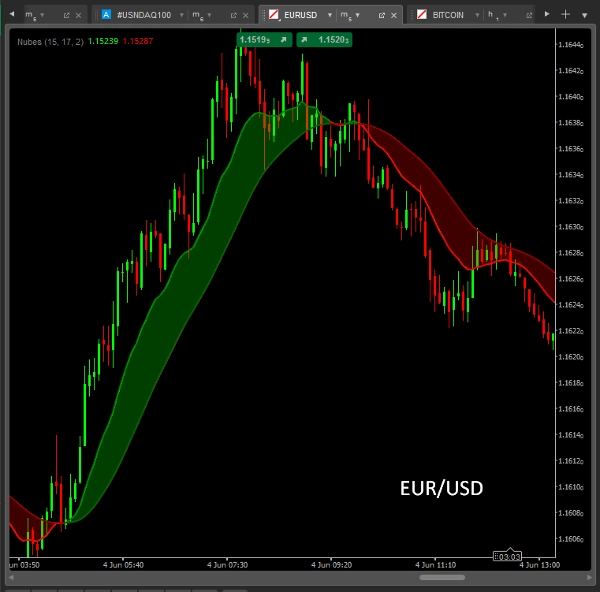
Der Algorithmus berechnet und projiziert gleichzeitig zwei gleitende Durchschnitte (einen Standard-MA und einen geglĂ€tteten MA). Der dynamische Raum zwischen beiden Linien wird mit einer intelligenten, farbwechselnden Wolke gefĂŒllt, die Marktrauschen eliminiert und klare visuelle BestĂ€tigungen in Echtzeit liefert.


100% anpassbare Eingabeparameter

Übernehmen Sie die volle Kontrolle ĂŒber die mathematischen Formeln, um Ihre spezifische Strategie anzupassen:

  • Schnelle MA Periode & Typ: Definieren Sie die Periode und die Berechnungsmethode (Einfach, Exponentiell, GeglĂ€ttet, Linear Gewichtet usw.) fĂŒr den schnellen gleitenden Durchschnitt.
  • Langsame MA Periode & Typ: Konfigurieren Sie die Parameter des langsamen gleitenden Durchschnitts, um die Tiefe der Wolke zu erweitern oder zu verengen.
  • Benutzerdefinierte Wolkentransparenz: Passen Sie einfach die OpazitĂ€t und Farben (GrĂŒn fĂŒr bullisch, Rot fĂŒr bĂ€risch) an, um perfekt zu Ihrem dunklen oder hellen cTrader-Arbeitsbereichsthema zu passen.


Wie man mit der Trendwolke handelt

  1. Trendfilter (Trendfolge): Wenn die Wolke grĂŒn ist, ist die Tendenz bullisch und Sie sollten Kauf-Setups priorisieren. Wenn die Wolke rot wird, ist die Tendenz bĂ€risch und Sie sollten sich auf Verkaufs-Setups konzentrieren.
  2. Pullback-Zonen (Zonaleinstiege): Die dynamische Wolke fungiert als schwebende UnterstĂŒtzungs- oder Widerstandszone. Warten Sie, bis der Preis die Wolke erneut testet oder in sie eintritt, ohne sie zu durchbrechen; eine Ablehnung der Wolkenzone ist Ihr AusfĂŒhrungssignal.
  3. Konsolidierungsfilter (Der Squeeze): Wenn sich die gleitenden Durchschnitte hĂ€ufig kreuzen und die Wolke extrem dĂŒnn wird, warnt Sie der Indikator vor einem flachen oder seitwĂ€rts gerichteten Markt und schĂŒtzt Sie vor falschen AusbrĂŒchen.

Zusammenfassung

KI-Zusammenfassung
Nubes_CTrader is a dynamic dual moving average cloud indicator designed for the cTrader platform. It simultaneously calculates and displays two moving averages—a Standard MA and a Smoothed MA—creating a color-coded cloud that visually represents market trends and reduces noise. The cloud changes color to indicate bullish (green) or bearish (red) market bias, helping traders identify trend direction in real time.

Key features include fully customizable input parameters for both fast and slow moving averages, allowing users to select period lengths and calculation methods such as Simple, Exponential, Smoothed, or Linear Weighted. The cloud’s transparency and colors can also be adjusted to fit different workspace themes.

The indicator supports multiple trading functions: it acts as a trend filter by signaling buy or sell bias based on cloud color; it identifies pullback zones where price retests the cloud for potential entry points; and it detects consolidation phases when the cloud narrows, warning of ranging markets to avoid false breakouts.

Nubes_CTrader is applicable to any asset and provides visual trend analysis, crossover signals, and pullback entry zones, supporting trading decisions with clear, real-time visual confirmations.
Indikatorprofil
Indikatorkategorie
Trend
Ausgabetyp
Visualisierung
Signale
Datenanforderungen
Nur Balken
UnterstĂŒtzte Signale
Durchbrechen
Ausbruch
TrendstÀrke
Level – BerĂŒhrung

Kundenbewertungen

0.0
Bewertungen: 0
Kundenbewertungen
Bisher gibt es keine Bewertungen fĂŒr dieses Produkt. Haben Sie es schon ausprobiert? Dann können Sie die erste Person sein, die andere darĂŒber informiert!

Diskussion

HĂ€ufig gestellte Fragen (FAQ)

EMA
Supertrend
AI-assisted
Supply & Demand
Moving Average
Support & Resistance
Über den cTrader Store verfĂŒgbare Produkte, einschließlich Handelsbots, Indikatoren und Plugins, werden von externen Entwicklern bereitgestellt und nur zu Informations- und technischen Zugriffszwecken verfĂŒgbar gemacht. cTrader Store ist kein Broker und erbringt keine Anlageberatung, persönlichen Empfehlungen oder eine Garantie fĂŒr zukĂŒnftige Performance.

Mehr von diesem Autor

Indikator
Imbalance
Supertrend
+5
Colorea las velas automÃ¥ticamente segÃÂșn los niveles mÃ¥ximos, mínimos y de cierre previos para definir tendencias.
Indikator
Imbalance
AI-assisted
+4
Predict continuity or rejection on range bars. Plots a precise visual box to anticipate candle close price levels.

Das könnte Sie auch noch interessieren

Indikator
The Weekly Daily Levels indicator shows the OHLC, and mid-point prices for the previous day and week.
Indikator
Signal
Cumulative Volume Delta tracks the net difference in tick volume between buying and selling pressure over time
Indikator
ZigZag Smart Alert for cTrader Description: ZigZag Smart Alert is a next-generation swing indicator for cTrader, designe
Indikator
AI
ATR
+20
Detects smart money activity using advanced tick volume and price divergence analysis.
Indikator
ATR
SMC
+2
HTF POWER 3 ICT Power of 3 · M1 Precision · H4 Intelligence Auto-detect Accumulation → Manipulation → Distribution
Indikator
AI
ATR
+27
Support and Resistance with signals
Indikator
ATR
RSI
+5
Advanced Anchored VWAP for cTrader: volatility bands, real‑time alerts & customizable session resets.
Indikator
Prop
Forex
+5
🎯 Order Block Detector - Smart Trading: Identifica bloques de órdenes clave en cTrader para un trading más inteligente.
Indikator
ATR
Volume
+2
Heatmap Liquidity Zones Visualize volume-at-price, uncover hidden support/resistance, and track market liquidity in real
Indikator
ATR
The Tenkan-ATR Indicator is a powerful and innovative indicator for Traders. SALE OFF!!!
Indikator
ATR
Volume
+5
Order blocks with measured hold-rate stats and confidence scoring — not just zones on a chart.
Indikator
Shows BUY & SELL signals for 3 & 4 BAR PATTERN (Morning star/ Evening star). It is adjustable and it will SHOW ARROWS.
Indikator
Key Levels
Support & Resistance
Clean psychological round-number grid with native pip and point auto-scaling across Forex, Gold, Indices, and Crypto.
Indikator
BOS
CHOCH
+5
MyZTrade High TF candle is a multi-timeframe visualisation tool that overlays completed higher-timeframe candles.
Indikator
BOS
Volume
+5
20/40/60-day IPDA lookback ranges, Premium/Discount/Equilibrium zones, and quarterly shift alerts — anchored to true dai
Indikator
Inside Bar
Save time by lighting a candle to look within yourself in another temporality
Indikator
XAUUSD
Professional Volume Profile Indicator - Shows volume distribution, POC, Value Areas & Buy/Sell pressure.
Indikator
Prop
Forex
+4
This is an indicator that can alert you about trendlines, horizontal lines and vertical lines.

Preis

Seit 10/03/2026
2
VerkÀufe