
Beschreibung
TREND ANALYSIS ist ein fortschrittlicher technischer Indikator für die cTrader-Plattform, der mehrere analytische Ansätze in einer einzigen Lösung kombiniert. Entwickelt für Trader, die eine Trendbestätigung durch Indikatorenkonvergenz suchen, bietet er eine vollständige Marktübersicht mit präzisen Signalen und Validierungsfiltern.
SEHEN SIE DAS EINFÜHRUNGSVIDEO ZUR BETRIEBSSTRATEGIE!
🎯 ANWENDUNGSSTRATEGIEN
1. Trendfolgestrategie
Anwendung: Etablierte Trends identifizieren und folgen
Zeitrahmen: H4, D1 für längere Positionen
Einstellungen: ADX > 25, Volumen über dem Durchschnitt
Risikomanagement: Stop-Loss unter dem 50-Perioden gleitenden Durchschnitt
2. Swing Trading
Anwendung: Mittelfristige Bewegungen erfassen
Zeitrahmen: H1, H4
Einstellungen: Volumenfilter aktiviert, Bestätigung durch Volume Profile
Ziele: Volume Profile POC als Take Profit
3. Breakout Trading
Anwendung: Einstieg bei Unterstützungs-/Widerstandsdurchbrüchen
Einstellungen: PVA-Volumen zur Bestätigung der Bewegungskraft
Bestätigung: Steigender ADX + Volumen über dem Durchschnitt
4. Scalping (kürzere Zeitrahmen)
Anwendung: Schnelle Trades mit mehreren Bestätigungen
Zeitrahmen: M1, M5
Einstellungen: Strenge Volumenfilter und Momentum
🔧 WIE DIE INDIKATOREN FUNKTIONIEREN
KERN ADX & DI
ADX (Average Directional Index)
Funktion: Messung der Trendstärke
Interpretation:
0-25: Schwacher Trend/Seitwärtsbewegung
25-50: Starker Trend
50+: Sehr starker Trend
Praktische Anwendung: Vermeiden Sie Trades, wenn ADX < 20 ist
+DI / -DI (Richtungsindikatoren)
+DI: Käuferstärke
-DI: Verkäuferstärke
Signal: Kreuzung von +DI über -DI (Kauf) und umgekehrt
ADX Slope (ADX Steigung)
Funktion: Messung der Trendbeschleunigung
Darstellung: Cyanfarbener Histogramm
Signal: Positive Werte zeigen einen sich verstärkenden Trend an
VOLUMENFILTER
Volumen MA Filter
Funktion: Validierung von Signalen mit überdurchschnittlichem Volumen
Parameter: Periode 20, Multiplikator 1.0
Verwendung: Bestätigung institutionellen Interesses
Volume PVA (Price Volume Analysis)
Farben und Bedeutung:
Grün: Kauf mit sehr hohem Volumen (>150% Durchschnitt)
Blau: Kauf mit hohem Volumen
Rot: Verkauf mit sehr hohem Volumen
Pink: Verkauf mit hohem Volumen
Gelb: Pin Bar/Erschöpfung mit Unterstützungsdurchbruch
VOLUME PROFILE
POC (Point of Control)
Funktion: Preis mit dem höchsten gehandelten Volumen
Verwendung: Natürliches Ziel für Trades, dynamische Unterstützung/Widerstand
Value Area
Funktion: Zone, in der 70% des Volumens gehandelt wurden
Interpretation:
Preis darüber: Aufwärtstrend
Preis darunter: Abwärtstrend
Innerhalb: Mögliche Seitwärtsbewegung
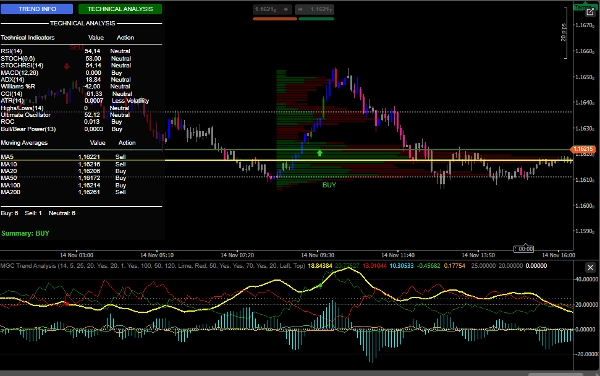
VOLLSTÄNDIGE TECHNISCHE ANALYSE
Indikator-Panel
RSI: Überverkauft (<30) / Überkauft (>70)
MACD: Momentum
Williams %R: Extreme Bedingungen
CCI: Umkehrerkennung
Stochastik: Kurzfristiges Momentum
Ultimate Oscillator: Multi-Zeitrahmen Momentum
Gleitende Durchschnitte
Vollständiges Set von Gleitenden Durchschnitten (5, 10, 20, 50, 100, 200)
Ausrichtungsanalyse für den Trend
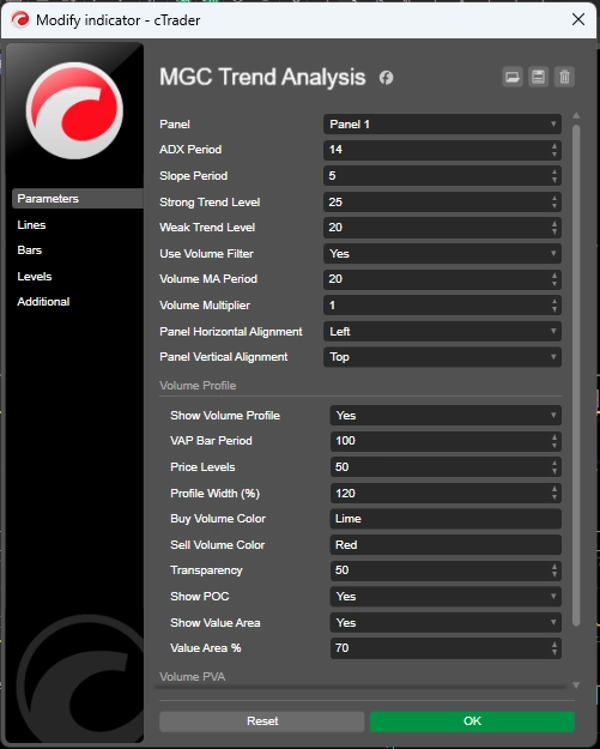
⚙️ EMPFOHLENE EINSTELLUNGEN
Konservative Einstellung
javascript
ADX Periode: 14
Steigungsperiode: 5
Starkes Trendniveau: 25
Schwaches Trendniveau: 20
Volumenfilter verwenden: true
Volumen MA Periode: 20
Volumenmultiplikator: 1.2
Aggressive Einstellung
javascript
ADX Periode: 10
Steigungsperiode: 3
Starkes Trendniveau: 20
Schwaches Trendniveau: 15
Volumenfilter verwenden: true
Volumen MA Periode: 14
Volumenmultiplikator: 1.0
Volume Profile (Empfohlen)
javascript
Volume Profile anzeigen: true
VAP Bar Periode: 100
Preisniveaus: 50
Value Area %: 70
POC anzeigen: true
🎨 VISUELLE RESSOURCEN
Benutzeroberfläche
Dynamisches Panel: Echtzeitinformationen
Interaktive Schaltflächen: Wechsel zwischen Analysen
Intuitive Farben: Funktionsbasierte Codierung
Grafische Signale
Pfeile: KAUF/VERKAUF Einstiege
Sounds: Hörbare Alarme
Balkenfarben: Integrierte PVA-Analyse
Zusammenfassung
Kundenbewertungen
5 | 67 % | |
4 | 33 % | |
3 | 0 % | |
2 | 0 % | |
1 | 0 % |


