


Description
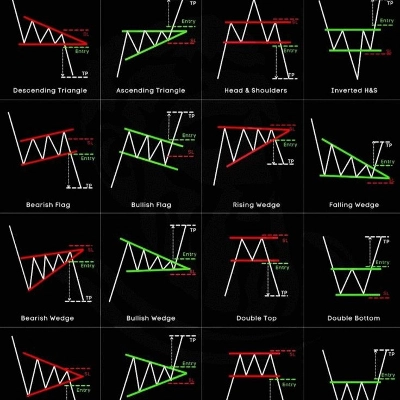
The AdvancedPatternRecognition algorithm is a highly sophisticated trading robot that uses advanced graphic pattern recognition techniques combined with statistical filters and technical indicators to identify selling (and buying) opportunities in the financial market. It operates based on multiple technical patterns, such as:
Head and Shoulders (H&S) – One of the most reliable patterns for trend reversal.
Double Top/Bottom – Classic resistance and support patterns.
Flags (Bullish/Bearish Flags) – Signals of continuation after consolidation.
Triangles (Ascending, Descending and Symmetrical) – Breakout indicators.
Wedges (Rising/Falling Wedges) – Reversal patterns with high accuracy.
Additionally, it employs advanced filters to increase the robustness of entries:
Moving Averages (MA200 and MA50)
Volume
ADX (Average Directional Index)
Candlestick Confirmation
Algorithm Trading Strategy
1. Advanced Chart Pattern Detection
The algorithm continuously monitors prices to identify well-known technical configurations such as Head & Shoulders, Triangles, and Flags, among others. Each pattern has a specific logic for detection, using:
Identification of significant peaks and valleys (FindSignificantPeaks and FindSignificantTroughs)
Neckline trend analysis
Volume and momentum confirmation (RSI, MACD, ADX)
2. Smart Filtering
To avoid false signals, the algorithm applies several filters:
Moving Averages: Ensures that trades are only made in the direction of the main trend (MA200 and MA50).
Volume: Increases confidence in trading when volume increases during breakouts.
ADX: Validates trend strength before entry.
Candlestick Confirmation: Avoids premature entries based on confirmed closes.
3. Dynamic Exit Management
Instead of relying solely on fixed Stop Loss and Take Profit, the algorithm uses fast and slow moving averages to exit the position as soon as there is a short-term reversal, optimizing profit and reducing losses.
4. Measured Move
Each detected pattern automatically calculates the measured move, i.e. the potential price range after the pattern is activated. This allows you to set realistic targets and adjust TP dynamically.
Summary
To enhance trade accuracy, it applies smart filters including Moving Averages (MA200 and MA50) to align trades with the main trend, volume analysis to confirm breakouts, ADX to validate trend strength, and candlestick confirmation to avoid premature entries. The bot features dynamic exit management by using fast and slow moving averages to exit positions upon short-term reversals, optimizing profits and minimizing losses. Additionally, it calculates the measured move for each detected pattern, estimating the potential price range after activation to set realistic and adjustable take profit targets.
This bot is designed for use in financial markets where technical chart patterns and momentum indicators are applicable, supporting strategies focused on breakout and trend reversal signals.
Discussion
Customer reviews
5 | 33 % | |
4 | 67 % | |
3 | 0 % | |
2 | 0 % | |
1 | 0 % |
FAQ














Price