Beschreibung
Hauptziel:
Kartierung der Volumenverteilung nach Preisniveau zur Identifizierung von:
Bereichen mit hoher Liquidität
Bereichen mit niedriger Liquidität
Ungleichgewichten zwischen Käufern und Verkäufern
Dieser Indikator ist mächtig, um die Marktstruktur zu verstehen und Bereiche mit hoher Wahrscheinlichkeit für Operationen zu identifizieren! 🎯
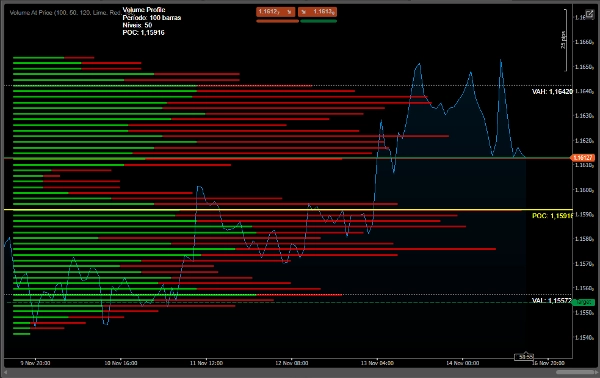
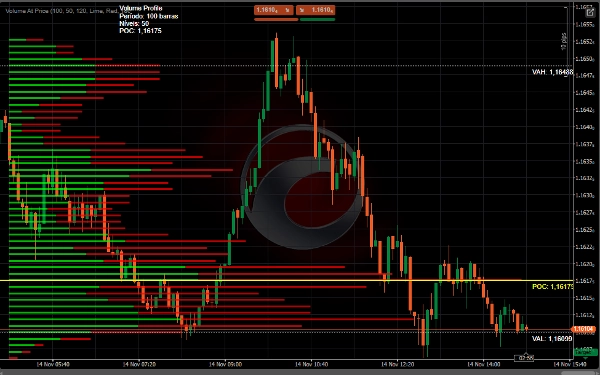
1. POC (Point of Control)
Gelbe Linie - Preis mit dem höchsten gehandelten Volumen
Bereich mit der größten Liquidität und Preis
Natürliche Unterstützung/Widerstand
2. Value Area
Weiße Linien - Bereich, in dem 70 % des Volumens gehandelt wurden
VAH (Value Area High) - Oberes Limit
VAL (Value Area Low) - Unteres Limit
Marktausgleichszone
3. Volumenkerne
🟢 Grün - Dominantes Kaufvolumen
🔴 Rot - Dominantes Verkaufsvolumen
Balkenlänge = Volumenintensität
📊 Anwendungsstrategien
1. Identifikation von Unterstützungen und Widerständen
• POC fungiert als dynamische Unterstützung/Widerstand
• Value Area definiert die Ausgleichszone
• Wichtige S/R-Profilgrenzen
2. Breakout-Analyse
• Ausbruch über VAH → Aufwärtstrend
• Ausbruch unter VAL → Abwärtstrend
• Kein Ausbruch-Volumen bestätigt Bewegung
3. Einstiegspunkte
• Kauf: Retest des VAL mit Käufervolumen
• Verkauf: Retest des VAH mit Verkäufervolumen
• Fade: Gegen die Extreme des Profils handeln
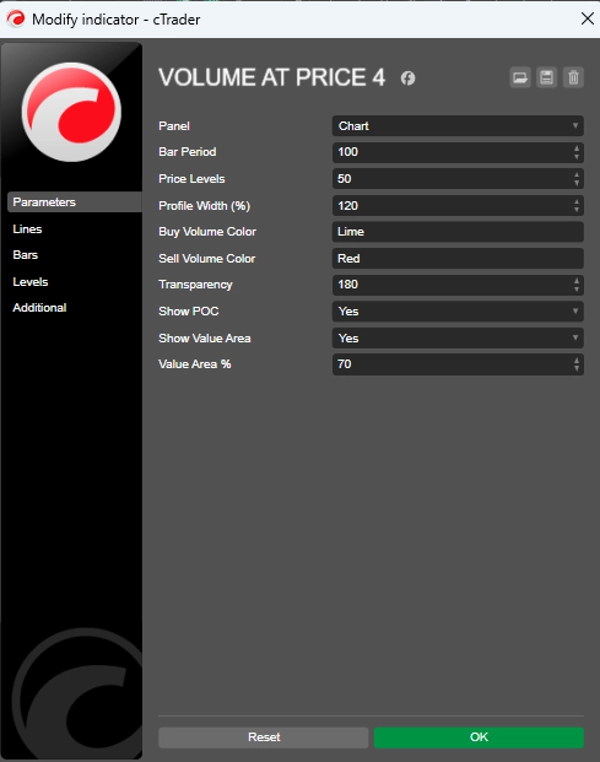
⚙️ Empfohlene Einstellungen
Für Day Trading
csharp
Periode = 50-100
Preisniveaus = 50
Profilbreite = 120%
Value Area % = 70
Für Swing Trading
csharp
Periode = 100-200
Preisniveaus = 80
Profilbreite = 150%
Value Area % = 70
✅ VORTEILE:
Identifiziert dynamische Unterstützungen/Widerstände
Zeigt Marktabsicht (Volumen)
Offenbart wichtige Liquiditätsbereiche
Klare Visualisierung von Ungleichgewichten
Aktuelle Volumen-Ticks zählen
Zusammenfassung
- Point of Control (POC): The price level with the highest traded volume, acting as a dynamic support or resistance.
- Value Area: The price range where 70% of volume is traded, defined by Value Area High (VAH) and Value Area Low (VAL), representing market balance zones.
- Volume Cores: Colored bars indicating dominant buying (green) or selling (red) volume, with bar length reflecting volume intensity.
The indicator supports strategies like identifying support and resistance levels, breakout analysis (trend direction based on VAH and VAL breaks), and entry points (buy near VAL with buyer volume, sell near VAH with seller volume, or fade at profile extremes).
Recommended settings vary by trading style: for day trading, shorter periods and narrower profiles; for swing trading, longer periods and wider profiles. This tool aids in visualizing liquidity, market intent, and volume imbalances to inform trading decisions.
Kundenbewertungen
5 | 0 % | |
4 | 50 % | |
3 | 50 % | |
2 | 0 % | |
1 | 0 % |