Beschreibung
🔥 Indikatorbeschreibung
Swing Profile cTrader ist ein fortschrittlicher visueller Indikator, der mehrere Werkzeuge in einem kombiniert:
- Swing-Erkennung
- Strukturelles ZigZag
- Einzel-Swing-Volumenprofil
- PoC (Point of Control)
- Geschätzte Volumendifferenz
- Optionale gleitende Durchschnittslinie
Die Idee ist einfach, aber sehr kraftvoll:
anstatt nur auf den Preis zu schauen, zeigt der Indikator wo das Volumen innerhalb jedes Swing-Beins konzentriert war.
In der Praxis sagt er nicht nur:
„der Preis ist gestiegen oder gefallen“
sondern auch:
„welcher Bereich innerhalb dieses Swings das eigentliche Schlachtfeld zwischen Käufern und Verkäufern war.“
Das ist sein echter Vorteil. 🚀
Swing Profile cTrader ist ein fortschrittlicher Indikator, der die Preisstruktur durch dynamische Swings, ZigZag-Logik und Volumenprofilierung für jedes einzelne Marktsegment analysiert.
Für jeden Swing hebt er die Volumenverteilung hervor, identifiziert den Point of Control und schätzt das Gleichgewicht zwischen Käufern und Verkäufern anhand der Delta-Volumen. Dies ermöglicht es Tradern, Gleichgewichtsbereiche, versteckte Unterstützungs- und Widerstandsniveaus, Fortsetzungszonen und potenzielle Trenderschöpfungen mit größerer Präzision zu erkennen.
Die optionale Integration des gleitenden Durchschnitts macht den Indikator sowohl für diskretionäres Chartlesen als auch für eine strukturiertere Richtungsfilterung geeignet.
🧠 Was er im Chart zeigt
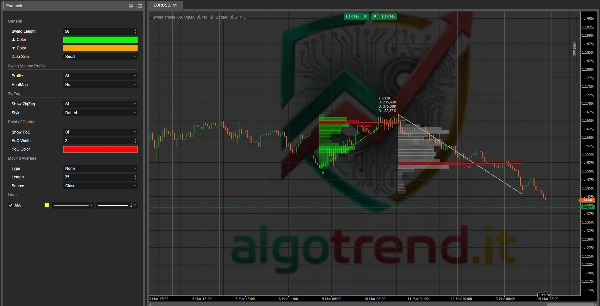
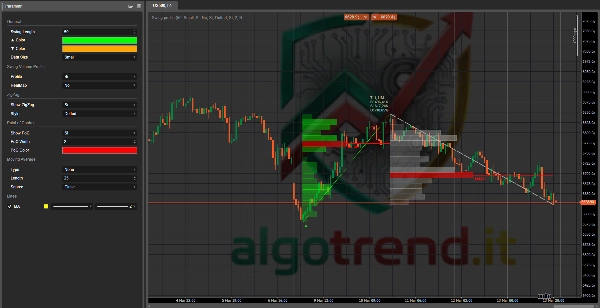
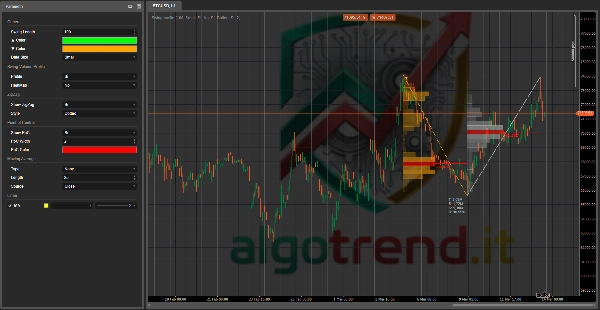
1) ZigZag
Die ZigZag-Linie verbindet die wichtigsten Swing-Hochs und Swing-Tiefs.
Sie hilft Ihnen:
- die Marktstruktur zu sehen
- impulsive Beine von korrigierenden Beinen zu unterscheiden
- zu verstehen, ob der Markt:
-
- höhere Hochs / höhere Tiefs
- oder niedrigere Hochs / niedrigere Tiefs
Wie man es liest
- ZigZag mit steigenden Swings = bullische Struktur
- ZigZag mit fallenden Swings = bärische Struktur
- kurzer, unruhiger ZigZag = chaotischer / seitwärts gerichteter Markt
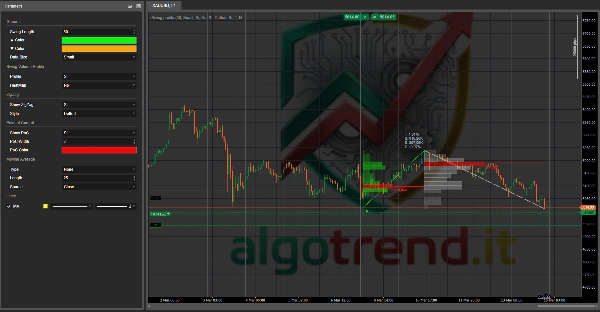
2) Swing-Volumenprofil
Dies ist der Kern des Indikators 💥
Für jeden abgeschlossenen Swing erstellt der Indikator ein vertikales Volumenprofil, das über Preiszonen verteilt ist.
Jeder horizontale Block repräsentiert:
- eine Preisspanne
- mit mehr oder weniger gehandeltem Volumen innerhalb dieser Spanne
Wie man es liest
- längere Blöcke = mehr Volumen in diesem Bereich
- kürzere Blöcke = weniger Volumen in diesem Bereich
So können Sie sofort verstehen:
- wo der Markt den Preis akzeptiert hat
- wo der Markt den Preis abgelehnt hat
- wo versteckte Unterstützungs-/Widerstandszonen existieren könnten
3) PoC – Point of Control
Der PoC ist die Preiszone mit dem höchsten Volumen innerhalb des Swings.
Es ist der Bereich, in dem die höchste Aktivitätskonzentration stattfand.
Bedeutung fürs Trading
Der PoC ist oft:
- ein Magnet für den Preis
- eine Zone des vorübergehenden Gleichgewichts
- ein zukünftiger Unterstützungs-/Widerstandsbereich
Praktische Regel
- über dem PoC = der Markt tendiert dazu, Stärke zu behalten
- unter dem PoC = der Markt tendiert dazu, an Stärke zu verlieren
- Rückkehr zum PoC = Schlüsselbereich, um auf Reaktion oder Ausbruch zu achten
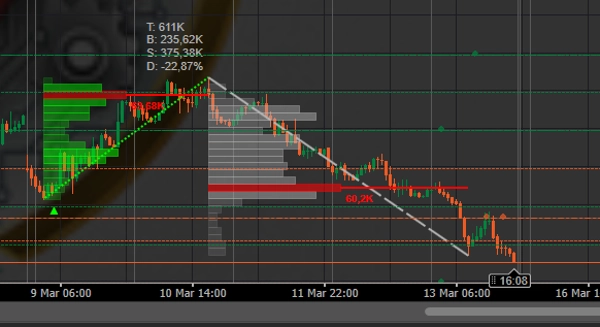
4) Delta-Volumen
Im Textfeld finden Sie:
- T = Gesamtvolumen
- B = Kaufvolumen
- S = Verkaufsvolumen
- D = Delta-Volumen %
In Ihrem Code wird das Delta folgendermaßen geschätzt:
- bullische Kerze → Volumen wird als Kaufvolumen gezählt
- bärische Kerze → Volumen wird als Verkaufsvolumen gezählt
Es ist also kein echtes professionelles Order-Flow-Delta, aber dennoch sehr nützlich als Druckmessinstrument.
Wie man es liest
- positives Delta = bullischer Druck dominiert
- negatives Delta = bärischer Druck dominiert
- Delta nahe Null = Gleichgewicht / Unentschlossenheit
5) Optionale gleitende Durchschnittslinie
Der gleitende Durchschnitt fungiert als Richtungsfilter.
Sie können ihn verwenden, um zu vermeiden, gegen den übergeordneten Trend zu handeln.
Einfache Anwendung
- Preis über MA = Long-Präferenz
- Preis unter MA = Short-Präferenz
📖 Wie man ihn richtig liest
A. Zuerst die Struktur lesen
Die erste Frage ist nicht „Soll ich einsteigen?“
Die erste Frage lautet:
baut der Markt eine bullische, bärische oder seitwärts gerichtete Struktur auf?
Schauen Sie sich das ZigZag an:
- höhere Hochs + höhere Tiefs = bullisch
- niedrigere Hochs + niedrigere Tiefs = bärisch
- chaotische, komprimierte Swings = Seitwärtsmarkt
Wenn Sie die Struktur nicht verstehen, verwenden Sie die Signale nicht.
B. Dann lesen, wo das Volumen konzentriert war
Schauen Sie sich das Profil des zuletzt abgeschlossenen Swings an.
Fragen Sie sich:
- war das Volumen oben konzentriert?
- in der Mitte?
- unten?
Interpretation
- Volumen konzentriert im oberen Teil eines bullischen Swings
= Käufer sind noch aktiv, gesunder Swing - Volumen konzentriert im unteren Teil eines bullischen Swings
= schwächere Bewegung, mögliche späte Erholung, aber geringere Qualität - Volumen konzentriert im oberen Teil eines bärischen Swings
= Distribution und Verkaufsdruck, der von höheren Preisen ausgeht - Volumen konzentriert im unteren Teil eines bärischen Swings
= bereits verlängerter Trend, Risiko der Erschöpfung
C. Schließlich den PoC beobachten
Der PoC ist oft der eigentliche Schlüssel zum Trade.
Wenn der Preis zum PoC zurückkehrt:
können diese 3 Dinge passieren:
- er prallt ab
- er konsolidiert
- er durchbricht und beschleunigt
Das bedeutet, der PoC sollte behandelt werden als:
- dynamische Unterstützung/Widerstand
- Retest-Bereich
- Entscheidungsebene
🎯 Hauptsignale zur Nutzung
1) PoC-Retest im Trend
Dies ist eines der besten Signale ✅
Long-Szenario
- bullische Struktur
- bullischer Swing mit gutem Delta
- Preis zieht zurück
- Preis kehrt nahe zum PoC des vorherigen Swings zurück
- der PoC hält
Signal: mögliche Long-Fortsetzung
Short-Szenario
- bärische Struktur
- bärischer Swing mit negativem Delta
- Preis prallt ab
- Preis kehrt zum PoC des vorherigen Swings zurück
- der PoC lehnt den Preis ab
Signal: mögliche Short-Fortsetzung
👉 Dies ist eine der intelligentesten Methoden, den Indikator zu verwenden.
2) PoC-Durchbruch
Wenn der Preis den PoC entschlossen durchbricht, bedeutet dies oft, dass sich das Gleichgewicht des vorherigen Swings verändert hat.
Wie man es liest
- sauberer PoC-Durchbruch + Schlusskurs darüber = möglicher Druckwechsel
- falscher Durchbruch + sofortige Rückkehr = Fake-Ausbruch
Nützlicher Trick
Beobachten Sie nicht nur den Durchbruch selbst.
Beobachten Sie wie sich der Preis verhält, wenn er zum PoC zurückkehrt.
Der Retest nach dem Ausbruch ist oft wertvoller als der Ausbruch selbst.
3) Reaktion in Niedrig-Volumen-Bereichen
Zonen, in denen das Profil schmal ist, sind Bereiche mit geringem Interesse.
Wenn der Preis durch sie hindurchgeht:
- beschleunigt er oft
- überquert er sie oft schnell
Praktische Anwendung
Wenn der Preis in einen Niedrig-Volumen-Bereich eintritt:
- erwarten Sie nicht viel Stabilität
- erwarten Sie leichtere Bewegungen
Dies sind ausgezeichnete Bereiche für:
- Ziele
- Beschleunigungen
- impulsive Ausbrüche
4) Delta-Divergenz
Jetzt kommen wir zu den echten Tricks 😏
Klassischer bärischer Fall
- Preis macht einen bullischen Swing
- aber das Delta verbessert sich nicht
- oder es verschlechtert sich
- oder der letzte Schub erfolgt bei geringem Volumen
Dies kann signalisieren:
- Erschöpfung
- fragile Aufwärtsbewegung
- mögliche Umkehr oder Korrektur
Bullischer Fall
- Preis fällt
- aber das bärische Delta nimmt nicht wirklich zu
- das Profil komprimiert sich
- der PoC verschiebt sich nach oben oder hält
Dies kann signalisieren:
- müdes Verkaufen
- mögliche Umkehr
5) Starke Swings vs Schwache Swings
Nicht alle Swings sind gleich.
Starker Swing
- gut definiertes Profil
- klarer PoC
- kohärentes Volumen
- Delta im Einklang mit der Richtung
- sauberes ZigZag
Schwacher Swing
- zerstreutes Volumen
- chaotisches Profil
- nicht überzeugendes Delta
- ungeordnete Struktur
👉 Die besten Signale kommen von starken Swings, nicht von schwachen.
🧩 Echte Tricks zur besseren Nutzung
Trick 1: Verwenden Sie den PoC niemals allein
Der PoC allein reicht nicht aus.
Der PoC funktioniert am besten, wenn er mit folgenden Punkten übereinstimmt:
- horizontaler Unterstützung/Widerstand
- Swing-Hoch/Tief
- MA
- Trendlinie
- psychologisches Niveau
Je mehr Übereinstimmungen, desto stärker das Signal.
Trick 2: Schauen Sie, wo der Swing begonnen hat
Hören Sie nicht beim Gesamtvolumen auf.
Schauen Sie wo innerhalb des Swings das Volumen konzentriert war.
Beispiel
Bullischer Swing mit sehr niedrigem PoC:
- kann frühe Akkumulation gefolgt von Expansion bedeuten
- oft gut, aber achten Sie auf tiefe Rücksetzer
Bullischer Swing mit sehr hohem PoC:
- kann bedeuten, dass der Markt höhere Preise akzeptiert hat
- sehr bullisch, wenn der Preis danach darüber bleibt
Trick 3: Die besten Trades sind oft bei der Rückkehr, nicht am Anfang
Viele Trader steigen ein, wenn sie eine starke Kerze sehen.
Oft ist das schon zu spät.
Mit diesem Indikator können Sie stattdessen warten auf:
- impulsiven Swing
- PoC-Identifikation
- Rückkehr des Preises
- Bestätigung des Haltens oder Ablehnens
Das gibt Ihnen sauberere Einstiege und bessere Stop-Setzung.
Trick 4: Verwenden Sie das Live-Bein mit Vorsicht
Das Live-Bein ist nützlich, aber auch der instabilste Teil.
Deshalb haben wir es im Code optional gemacht.
Regel
- abgeschlossene Swings = zuverlässiger
- Live-Swings = reaktiver, aber lauter
Wenn Sie Präzision wollen, gewichten Sie abgeschlossene Swings höher.
Trick 5: Verwechseln Sie hohes Volumen nicht mit einem starken Signal
Hohes Volumen bedeutet nicht automatisch Umkehr oder Fortsetzung.
Hohes Volumen bedeutet nur:
der Markt hat dort viel Aufmerksamkeit geschenkt.
Dann müssen Sie verstehen, ob dieser Bereich:
- Akkumulation
- Distribution
- Absorption
- Gleichgewicht
Trick 6: Verwenden Sie Delta als Bestätigung, nicht als Chef
Das Delta hier ist eine Schätzung, kein echtes Footprint-Delta.
Es sollte also so verwendet werden:
- niemals allein
- ja als Bestätigung
- ja zum Vergleich eines Swings mit dem vorherigen
✅ Wie man ihn operativ nutzt
Ideales Long-Setup
- bullische Struktur
- Preis über MA
- bullischer Swing mit gutem Volumen
- positives oder sich verbesserndes Delta
- Pullback zum PoC oder Hochvolumenbereich
- bullische Reaktion auf dem Niveau
Einstieg:
- bei Bestätigung der Reaktion
Stop:
- unter dem Swing oder unter dem PoC, je nach Aggressivität
Ziel:
- vorheriges Hoch
- Niedrig-Volumen-Zone
- Swing-Verlängerung
Ideales Short-Setup
- bärische Struktur
- Preis unter MA
- bärischer Swing mit gutem Volumen
- negatives oder sich verschlechterndes Delta
- Abpraller zum PoC
- bärische Ablehnung vom Bereich
Einstieg:
- bei Bestätigung der Ablehnung
Stop:
- über dem Swing oder über dem PoC
Ziel:
- vorheriges Tief
- Niedrig-Volumen-Zone
- neue Verlängerung
⚠️ Wann man ihn NICHT verwenden sollte
Vermeiden Sie ihn oder reduzieren Sie die Gewichtung seiner Signale, wenn:
- der Markt flach und seitwärts läuft
- die Swings zu klein sind
- das Symbol unzuverlässiges Tick-Volumen hat
- der Zeitrahmen zu niedrig und zu laut ist
- wichtige Nachrichten bevorstehen
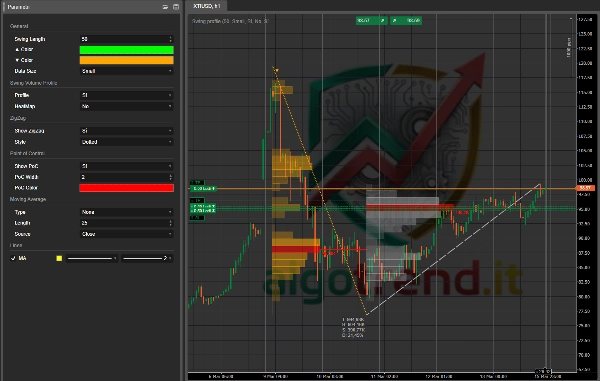
🛠️ Empfohlene Einstellungen
Für Intraday
- Swing-Länge: 20–40
- Lookback-Bars: 300–500
- Max Bins: 30–50
- Live-Bein anzeigen: false
- HeatMap: false
Für Swing-Trading
- Swing-Länge: 50–80
- Lookback-Bars: 500–800
- Max Bins: 40–60
Für ein sauberes Chart
- Profil: true
- HeatMap: false
- ZigZag anzeigen: true
- PoC anzeigen: true
📌 Super praktische Zusammenfassung
Lesen Sie ihn immer in dieser Reihenfolge:
1. Struktur
Trend oder Range?
2. Swing
Was ist der letzte wichtige Swing?
3. Profil
Wo war das Volumen konzentriert?
4. PoC
Wo ist das echte Gleichgewicht des Swings?
5. Delta
Bestätigt der Druck das oder nicht?
6. Kontext
Stimmt das Niveau mit anderen Übereinstimmungen überein?
Zusammenfassung
Key features include the Point of Control (PoC), representing the price zone with the highest volume within a swing, which acts as a dynamic support/resistance and equilibrium level. The indicator estimates delta volume by categorizing volume on bullish bars as buy volume and on bearish bars as sell volume, providing insights into buying or selling pressure. An optional moving average serves as a directional filter to align trades with broader trends.
Users can interpret volume concentration within swings to assess market strength, potential reversals, or trend exhaustion. The indicator supports various markets including Forex, indices, commodities, stocks, and cryptocurrencies such as BTCUSD and EURUSD. It is suitable for intraday and swing trading with configurable parameters for swing length, lookback bars, and volume bins. The tool aids in identifying key trade signals like PoC retests, breakouts, low-volume area reactions, and delta divergences for more informed trading decisions.