present
Zarejestruj się i otrzymaj 50 $ zniżki na pierwszy zakup
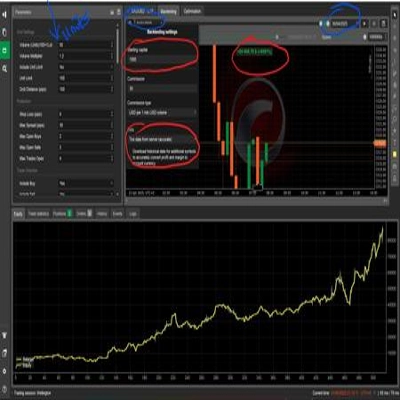
Trading product for ZIG ZAG Wskaźnik Premium/Discount  Head and Shoulders, image 1
ZIG ZAG
Wskaźnik
Wersja 1.0, May 2026
Windows, Mac
4.4
Opinie: 5
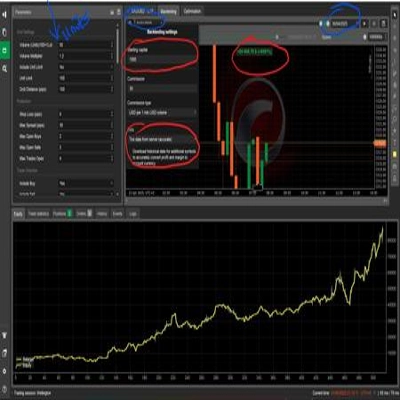
Trading product for ZIG ZAG Wskaźnik Premium/Discount  Head and Shoulders, image 2
Trading product for ZIG ZAG Wskaźnik Premium/Discount  Head and Shoulders, image 3
Trading product for ZIG ZAG Wskaźnik Premium/Discount  Head and Shoulders, image 4
82.74M
Wolumen transakcji
50.16K
Zysk w pipsach
5
Sprzedaż
418
Bezpłatne instalacje

Opis

Wskaźnik ZigZag

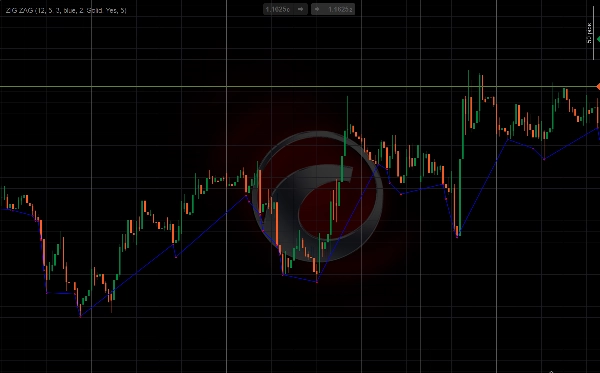
Ten konfigurowalny ZigZag wskaźnik filtruje drobny szum cenowy i łączy tylko najważniejsze lokalne maksima i minima za pomocą serii linii, dając traderom przejrzystą wizualną mapę struktury rynku i kluczowych punktów zwrotnych.

Działa poprzez skanowanie przesuwającego się okna świec (Depth) w celu identyfikacji istotnych punktów zwrotnych, potwierdzając ruch tylko wtedy, gdy przesunięcie od poprzedniego przeciwnego punktu przekracza minimalny procent Deviation. Ustawienie Backstepzapewnia, że dwa punkty zwrotne tego samego typu nie są rejestrowane zbyt blisko siebie, utrzymując wynik czysty i istotny.

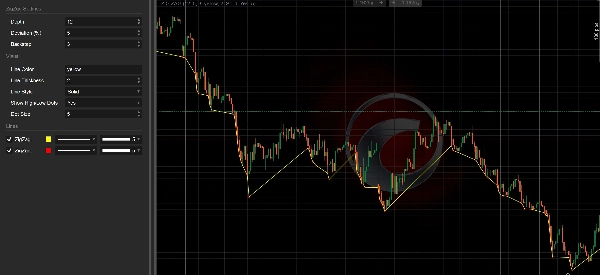
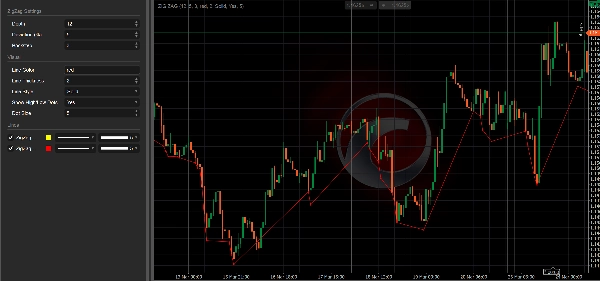
Wizualnie linie łączące ujawniają strukturę trendu na pierwszy rzut oka — linie rosnące wskazują na wyższe maksima i minima; linie opadające wskazują na niższe maksima i minima. Opcjonalne kropki precyzyjnie oznaczają każdy potwierdzony punkt zwrotny, przydatne jako punkty wsparcia, oporu i odniesienia do wzorców.

Kluczowe parametry — Depth, Deviation i Backstep — kontrolują czułość wskaźnika. Wyższe wartości generują mniej, ale większe ruchy, odpowiednie do analizy na wyższych ramach czasowych; niższe wartości wychwytują częstsze punkty zwrotne do pracy na krótszych interwałach. Kolor, grubość i styl linii są w pełni konfigurowalne.

Traderzy mogą używać tego wskaźnika do: analizy struktury trendu, mapowania wsparcia i oporu, rozpoznawania formacji wykresów (podwójne szczyty/dna, głowa i ramiona) oraz kotwiczenia zniesień Fibonacciego do potwierdzonych punktów zwrotnych.

Może być używany na dowolnej parze handlowej.

Podsumowanie

Podsumowanie AI
The Zig Zag indicator is a customizable technical analysis tool designed to filter out minor price fluctuations and highlight significant swing highs and lows on a price chart. It operates by scanning a rolling window of bars (Depth) to identify meaningful pivot points, confirming swings only when price moves exceed a specified minimum Deviation percentage. The Backstep parameter prevents registering pivots of the same type too close together, ensuring clarity.

Visually, the indicator connects these pivots with lines that reveal market trend structure: rising lines indicate higher highs and lows, while falling lines show lower highs and lows. Optional dots mark confirmed pivots, which can serve as reference points for support, resistance, and chart pattern recognition.

Key adjustable settings—Depth, Deviation, and Backstep—allow users to tailor sensitivity for different timeframes, from capturing large swings on higher timeframes to more frequent pivots on shorter-term charts. Line color, thickness, and style are fully customizable.

Traders use the Zig Zag indicator for analyzing trend structure, mapping support and resistance levels, identifying classical chart patterns such as head and shoulders, double tops/bottoms, and anchoring Fibonacci retracements to confirmed swing points. It is applicable to any trading pair and supports visualization and signal outputs for breakout and reversal events based on bar data.
Profil wskaźnika
Kategoria wskaźnika
Trend
Typ wyjścia
Wizualizacja
Sygnały
Wymagania dotyczące danych
Tylko słupki
Obsługiwane sygnały
Przełamanie
Odwrócenie trendu

Opinie klientów

4.4
Opinie: 5
5
40 %
4
60 %
3
0 %
2
0 %
1
0 %
Opinie klientów
May 31, 2026
May 30, 2026
May 23, 2026
it feels useful once the click feels less impulsive, and half size is enough at the start.
May 22, 2026
ZIG ZAG is a classic market structure indicator that helps simplify price action by filtering out minor noise and highlighting meaningful swing highs and lows. It works well for trend structure analysis, Fibonacci anchoring, and chart pattern recognition. Lightweight, flexible, and visually clean, it remains one of the most practical tools for discretionary technical analysis.
May 22, 2026
The first 10 trades should stay boring, and the trade idea gets slowed down first.

Dyskusja

Częste pytania

Premium/Discount
Head and Shoulders
Flag
Key Levels
Market Structure
Supply & Demand
Support & Resistance
Produkty dostępne za pośrednictwem cTrader Store, w tym boty handlowe, wskaźniki i wtyczki, dostarczane są przez deweloperów zewnętrznych i udostępniane wyłącznie w celach informacyjnych oraz w celu zapewnienia dostępu technicznego. cTrader Store nie jest brokerem i nie zapewnia doradztwa inwestycyjnego, nie udziela spersonalizowanych rekomendacji ani nie gwarantuje przyszłych wyników.

Więcej od tego autora

cBot
XAUUSD
Commodities
Need Trial Version of Rocket Drive? Get it here
Wskaźnik
EMA
RSI
+5
MACD Colour Histogram with 11 Moving Average Types, Multi-timeframe confirmation and Sound Signal Alert.
Wskaźnik
Market Structure
An indicator That tracks the four major forex sessions — Sydney, Tokyo, London, and New York, with DST
cBot
AI
XAUUSD
+1
An AI infused Self Gold Recalibration Robot that uses custom indicator with 4 Take Profit features to maximize profit.
Wskaźnik
BOS
Key Levels
+2
Realtime Trade Adviser will tell you When to BUY and When to SELL. A real time Trade Prompter
Wskaźnik
Inducement
Key Levels
+5
Digital Clock Overlay that displays a live, second-by-second clock and optional date directly on the trading chart.
Wskaźnik
ATR
Fibonacci
+1
Trading Clock Pro: An all-in-one market timing dashboard designed to help traders understand the market at one Spot.

Możesz także polubić

Logo „ATR Bands”
Popularne
4.7
(4)
$19
Wskaźnik
ATR
Prop
+13
Enhance trading with ATR Bands! Visualize market volatility using dynamic upper and lower ATR bands for precise decision
Wskaźnik
Forex
BTCUSD
+11
Next-gen Volume Oscillator using Hyperbolic Tangent math. No repainting. Includes arrows, alerts, and overlay mode 🎯
Logo „heatmap kopie”
Najwyżej oceniane
4.2
(4)
$19
/
$29
Wskaźnik
AI
SMC
+13
Dynamic Liquidity Depth exposes hidden volume
Wskaźnik
Volume
Channel
+5
Spots volatility squeezes before they fire — the compression phase everyone else misses.
Wskaźnik
Displays the previous day's, last week's, and last month's highest and lowest price levels on your chart.
Wskaźnik
BOS
MSS
+5
Your entire ICT session map, structure engine, and key levels — No manual work. One indicator. Every session!
Wskaźnik
MSS
Key Levels
+2
Fractal based market structure indicator that identifies HH, HL, LH, and LL pivot with confirmed, non-repainting fractal
Wskaźnik
ATR
SMC
+5
Candles Volume Delta is a powerful, visually intuitive indicator that transforms raw tick volume into actionable trading
Wskaźnik
ATR
Prop
+14
Optimize exits with Chandelier Exit! Visualize stop-loss points dynamically for improved trading precision and safety.
Wskaźnik
Signal
Cumulative Volume Delta tracks the net difference in tick volume between buying and selling pressure over time
Wskaźnik
Prop
Forex
+13
Decision System Indicator According to Cosmic Laws
Wskaźnik
Pin Bar
Inducement
+5
Institutional Nasdaq Session Liquidity Map with Live Point HUD, Sweep Alerts & Interactive Playbook.
Wskaźnik
RSI
XAUUSD
+2
Automatic ZigZag swings with dynamic support & resistance levels, labeling highs/lows for clear trend signals.
Wskaźnik
RSI
Signal
+2
Dynamic circles visualize price's volatility position. Like RSI for market overextension & stretch. Quantify context.
Wskaźnik
ATR
Forex
+7
Final Moving Average is an adaptive system designed to keep traders aligned with the true direction of the market
Wskaźnik
Breakout
Allow trader to visualize Support & Resistance across different timeframes,give trader an overview of the current market
Wskaźnik
SmartFibonacci — automatic Fibonacci retracements & extensions with swing detection, alerts and clean labels for cTrader
Wskaźnik
MSS
Key Levels
+2
Simple Support and Resistance automatically calculates key price structure. plots clean minimal S/R lines, no clutter

Cena

82.74M
Wolumen transakcji
50.16K
Zysk w pipsach
5
Sprzedaż
418
Bezpłatne instalacje