present
Zarejestruj się i otrzymaj 50 $ zniżki na pierwszy zakup
Trading product for HIO Mutil Currency CCI Scanner Wskaźnik Volume CCI, image 1
HIO Mutil Currency CCI Scanner
Wskaźnik
Wersja 1.0, May 2026
Windows, Mac
4.6
Opinie: 3
Trading product for HIO Mutil Currency CCI Scanner Wskaźnik Volume CCI, image 2
Trading product for HIO Mutil Currency CCI Scanner Wskaźnik Volume CCI, image 3
Trading product for HIO Mutil Currency CCI Scanner Wskaźnik Volume CCI, image 4
Trading product for HIO Mutil Currency CCI Scanner Wskaźnik Volume CCI, image 5
Od 12/06/2025
1
Sprzedaż
399
Bezpłatne instalacje

Opis

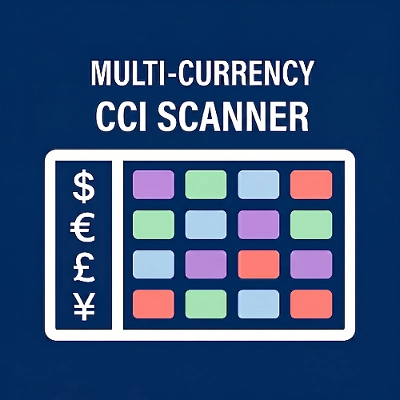
The HIO Multi-Currency CCI Scanner to niestandardowy wskaźnik cTrader zaprojektowany w celu optymalizacji Twojego środowiska handlowego. Zamiast przełączać się między wieloma otwartymi wykresami, ten wskaźnik zapewnia scentralizowany pulpit do monitorowania wartości Commodity Channel Index (CCI) dla wielu symboli i ram czasowych jednocześnie. Został stworzony, aby pomóc traderom w identyfikacji potencjalnych ekstremów rynkowych i kontynuacji trendów z jednego panelu.

Kluczowe funkcje

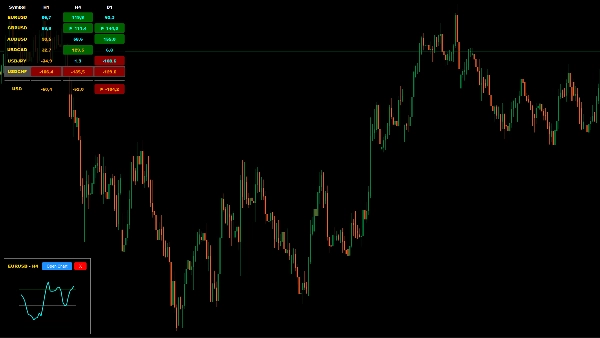
  • Macierz wielosymbolowa i wieloramowa: Monitoruj symbole i ramy czasowe zdefiniowane przez użytkownika w jednym, zunifikowanym panelu na wykresie cTrader.
  • Obliczanie siły waluty: Zawiera zintegrowany miernik, który szacuje siłę docelowej waluty za pomocą algorytmu CCI ważonego wolumenem.
  • Interaktywne mini-wykresy: Kliknij dowolną komórkę danych na pulpicie, aby otworzyć unoszący się mini-wykres, pozwalający na przeglądanie szczegółowej linii CCI bez opuszczania głównego środowiska pracy.
  • Zintegrowane alerty Telegram: Połącz swojego bota Telegram, aby otrzymywać powiadomienia, gdy pojedyncze ramy czasowe — lub zbieżność wszystkich ram czasowych — wchodzą lub wychodzą z wcześniej zdefiniowanych stref ekstremalnych.
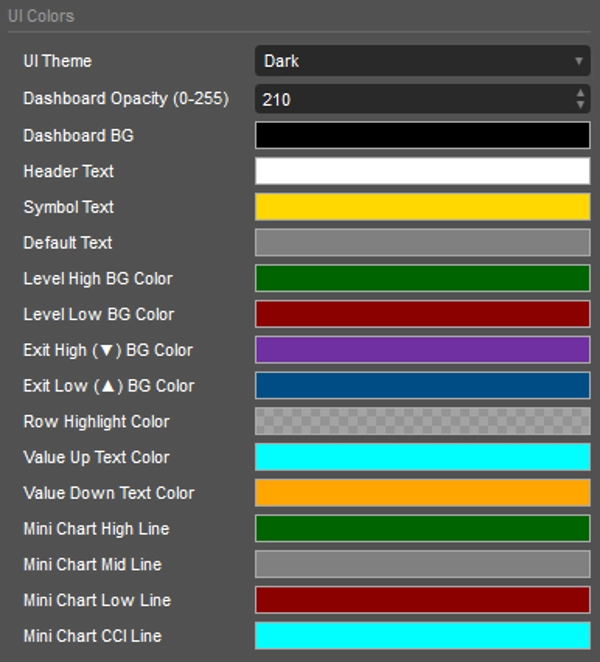
  • Dostosowywalny interfejs użytkownika: W pełni adaptacyjny design z motywami kolorystycznymi Light, Dark lub Custom, które integrują się bezproblemowo z preferowanym środowiskiem cTrader.

Konfiguracja i parametry

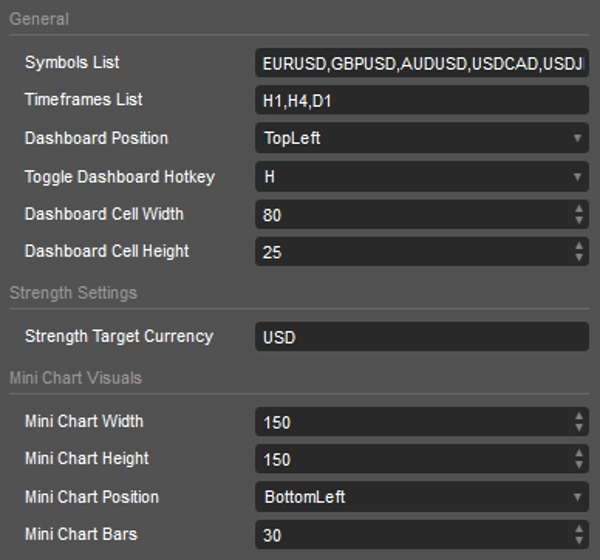
  • Symbole i ramy czasowe: Wprowadź wybrane aktywa i ramy czasowe, używając wartości oddzielonych przecinkami (np. EURUSD, GBPUSD oraz h1, h4, d1).
  • Waluta docelowa: Zdefiniuj walutę bazową (np. USD) do obliczeń miernika siły.
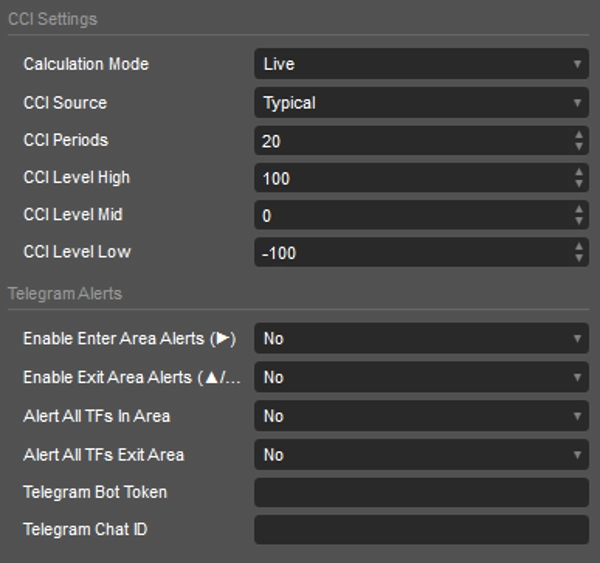
  • Ustawienia CCI: Dostosuj podstawowe parametry, w tym tryb obliczeń (na żywo/zamknięcie słupka), źródło danych (np. zamknięcie, maksimum, minimum), okresy oraz konkretne progi wykupienia/wyprzedania.
  • Konfiguracja alertów: Wprowadź token bota Telegram i ID czatu, aby włączyć zdalne powiadomienia push.

Legenda pulpitu (kolory i symbole)

Pulpit wykorzystuje wskazówki wizualne do szybkiego przekazywania danych o momentum:

  • Ciemnozielone tło: CCI aktualnie znajduje się w strefie wykupienia.
  • Ciemnoczerwone tło: CCI aktualnie znajduje się w strefie wyprzedania.
  • Fioletowe/niebieskie tła: CCI aktywnie wychodzi z powrotem ze strefy ekstremalnej.
  • (Wejście): Momentum aktywnie wchodzi w ekstremalny próg.
  • (Spadek/wyjście): Wychodzi ze strefy wykupienia, wskazując na potencjalne momentum spadkowe.
  • (Wzrost/wyjście): Wychodzi ze strefy wyprzedania, wskazując na potencjalne momentum wzrostowe.

Uwaga: To narzędzie zostało zaprojektowane do celów analitycznych, aby wspomagać Twój workflow analizy technicznej w cTrader.

Podsumowanie

Podsumowanie AI
The HIO Multi-Currency CCI Scanner is a custom indicator for the cTrader platform that consolidates Commodity Channel Index (CCI) data across multiple currency pairs and timeframes into a single interactive dashboard. It enables traders to monitor user-defined symbols and timeframes simultaneously, reducing the need to switch between multiple charts. The tool includes a volume-weighted currency strength meter based on CCI values, helping to assess market momentum for a selected base currency.

Key features include clickable mini-charts for detailed CCI visualization within the dashboard, customizable CCI parameters (such as calculation mode, data source, periods, and threshold levels), and integrated Telegram alerts that notify users when CCI values enter or exit predefined extreme zones. The user interface supports light, dark, and custom color themes to fit various trading environments.

The dashboard uses color-coded backgrounds and symbols to indicate momentum states: dark green for overbought, dark red for oversold, purple/blue for crossing out of extremes, and arrows to show entering or exiting momentum zones. Users configure symbols, timeframes, target currency, and alert settings via input parameters. This indicator is designed to streamline technical analysis workflows by providing centralized, real-time CCI insights across multiple markets and timeframes.
Profil wskaźnika
Kategoria wskaźnika
Dynamika
Typ wyjścia
Wizualizacja
Sygnały
Filtr
Wymagania dotyczące danych
Tylko słupki
Dane tickowe
Wolumen
Obsługiwane sygnały
Przecięcie
Dywergencja
Siła trendu
Zmienność
Dotknięcie poziomu
Przebicie poziomu
Odwrócenie trendu

Opinie klientów

4.6
Opinie: 3
5
67 %
4
33 %
3
0 %
2
0 %
1
0 %
Opinie klientów
May 24, 2026
May 22, 2026
May 15, 2026
not bad if the rules are already clear. A clean signal can still fail.

Dyskusja

Częste pytania

Volume
CCI
Produkty dostępne za pośrednictwem cTrader Store, w tym boty handlowe, wskaźniki i wtyczki, dostarczane są przez deweloperów zewnętrznych i udostępniane wyłącznie w celach informacyjnych oraz w celu zapewnienia dostępu technicznego. cTrader Store nie jest brokerem i nie zapewnia doradztwa inwestycyjnego, nie udziela spersonalizowanych rekomendacji ani nie gwarantuje przyszłych wyników.

Więcej od tego autora

Wskaźnik
Forex
BTCUSD
+9
On-chart economic calendar with custom filters and automated Telegram alerts. Never miss high-impact news!
Wskaźnik
Forex
BTCUSD
+13
Multi-symbol Inside Bar Scanner with dashboard & breakout alerts
Wskaźnik
Forex
BTCUSD
+10
(ViPi) MTF Candle displays multiple higher timeframe candles right on your current chart for ultimate trend analysis.
Wskaźnik
Prop
Forex
+14
Pro Inside Bar Scanner with smart Telegram alerts & multi-timeframe dashboard
Wskaźnik
RSI
Volume
Scan RSI across multiple timeframes/symbols with real-time Telegram alerts and interactive visual mini-charts.
Wskaźnik
Volume
Stochastic
Multi-symbol & multi-timeframe Stochastic scanner with interactive mini-charts and Telegram alerts
Wskaźnik
Key Levels
Display live economic events directly on your chart with impact filters and automated advance notifications.

Możesz także polubić

Wskaźnik
The Multi-Timeframe Candle Indicator displays candles from multiple timeframes in one window, enhancing market analysis!
Wskaźnik
Indices
Commodities
The Advanced CCI & EMA Indicator combines the CCI with 40 & 80 EMA logic to generate precise arrows signaling direction
Wskaźnik
Prop
Forex
+4
Fractals is a precision-engineered trading indicator for cTrader that reveals the hidden architecture of price action.
Wskaźnik
RSI
MACD
+7
The ZigZag indicator is a technical analysis tool primarily used to identify key price reversal points.
Wskaźnik
Pin Bar
Inducement
+5
Institutional Nasdaq Session Liquidity Map with Live Point HUD, Sweep Alerts & Interactive Playbook.
Wskaźnik
BOS
MSS
+5
One indicator, full ICT/SMC picture — structure, OBs, FVGs, liquidity, Premium/Discount — with graded PRIME/SETUP signal
Wskaźnik
BOS
CHOCH
+5
A professional-grade cTrader indicator for traders following the Inner Circle Trader (ICT) methodology.
Wskaźnik
MSS
Key Levels
+2
Simple Support and Resistance automatically calculates key price structure. plots clean minimal S/R lines, no clutter
Wskaźnik
Volume
Key Levels
+2
Support and resistance from a rolling volume profile, ranked by strength or recency, updated live.
Wskaźnik
RSI
Breakout
+1
"Identify key market zones and visualize support/resistance from multiple timeframes on a single chart.
Wskaźnik
Displays the previous day's, last week's, and last month's highest and lowest price levels on your chart.
Wskaźnik
RSI
Signal
+2
Identifies trends with moving averages & volatility. Base levels = bullish 🐂 or bearish 🐻 signals. Reversals detected!
Wskaźnik
ATR
RSI
+3
🚀 Specialized algorithm is designed to confirm entry and exit points with precision 🎯
Wskaźnik
Key Levels
Order Block
+5
Pixel-perfect trading zones in a click! Instantly draw, resize & color via hotkeys. Automate your charting routine
Wskaźnik
Signal
USDJPY
See USD demand in one line—Composite OBV fuses six major FX pairs into a clear momentum gauge.
Logo „supertrend”
Popularne
4.3
(3)
$20
Wskaźnik
ATR
Prop
+4
Supertrend Indicator
Wskaźnik
The long awaited new and improved Supply Demand Premium V2 indicator. Unlock greater trading opportunities now!
Wskaźnik
Allow trader to draw multi trendlines in different timeframes on one chart,Give trader an overview of the current market

Cena

Od 12/06/2025
1
Sprzedaż
399
Bezpłatne instalacje