
HIO Mutil Currency Stochastic Scanner
Indicator
Version 1.1, May 2026
Windows, Mac
4.5
Reviews: 2
Description
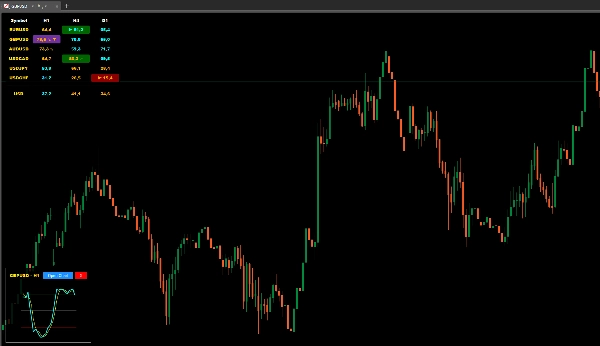
The HIO Multi-Currency Stochastic Scanner is an advanced dashboard indicator designed to streamline your market analysis. Instead of opening dozens of charts, this tool allows you to monitor the Stochastic Oscillator across multiple symbols and timeframes simultaneously from a single panel. It assists traders in identifying potential market conditions efficiently, saving time and keeping your workspace organized.
Key Features
- Multi-Symbol & Timeframe Monitoring: Track up to dozens of currency pairs across your chosen timeframes in one clean grid.
- Interactive Mini-Charts: Click on any cell to open a pop-up mini-chart, allowing you to instantly visualize the Stochastic lines and K/D crosses without leaving your current chart.
- Currency Strength Meter: Features a dedicated row to calculate the weighted strength of a target currency (e.g., USD) based on Stochastic and volume data.
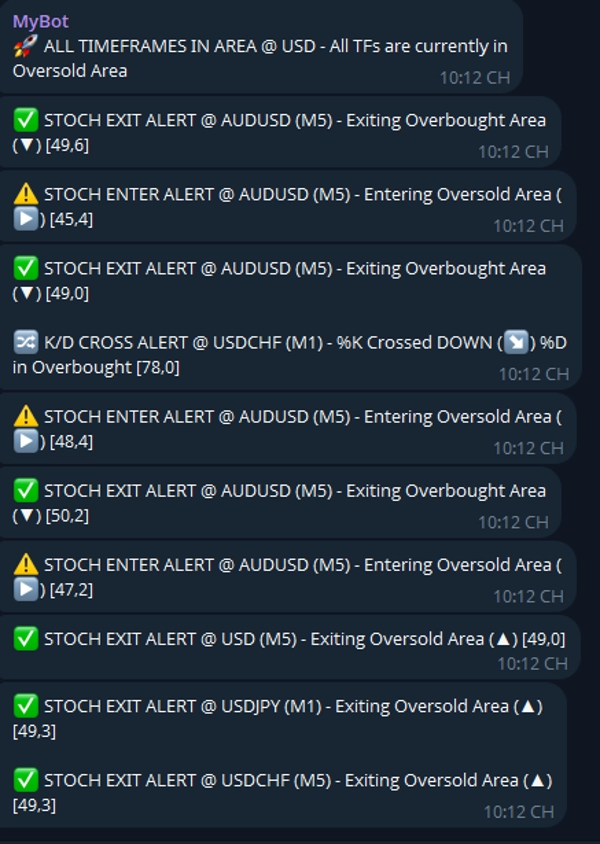
- Comprehensive Alerts: Supports Telegram notifications for entering/exiting Overbought (OB) and Oversold (OS) areas, as well as K/D crossovers.
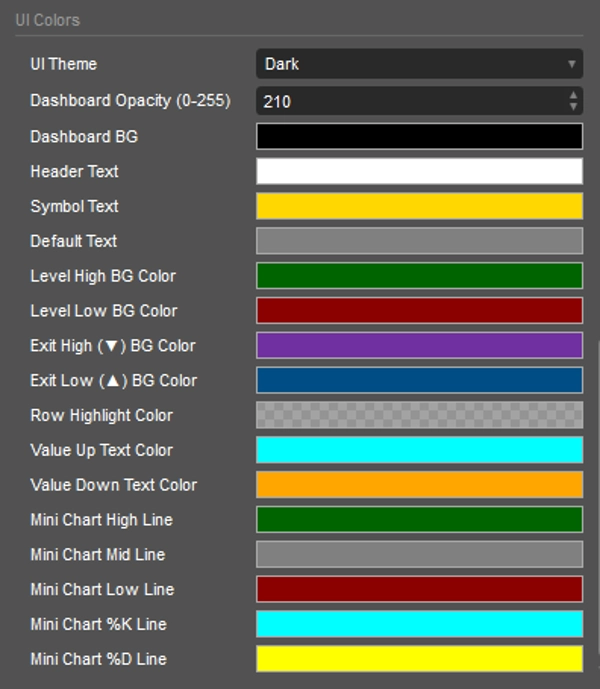
- Customizable UI: Choose between Dark, Light, or Custom themes. Toggle the dashboard visibility instantly with a hotkey.
Setup & Parameters
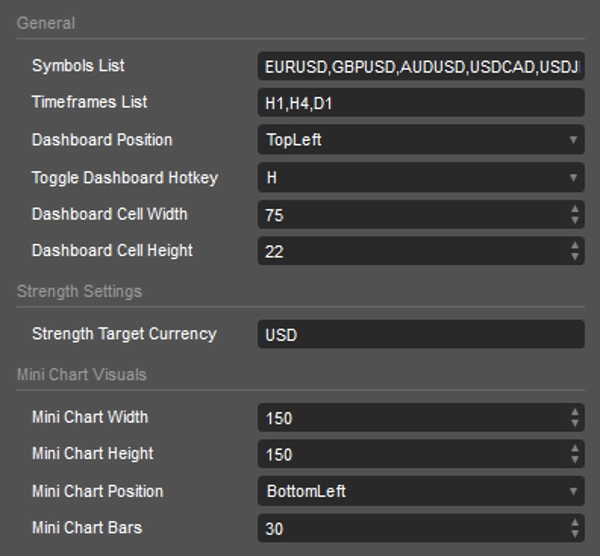
- General: Define your
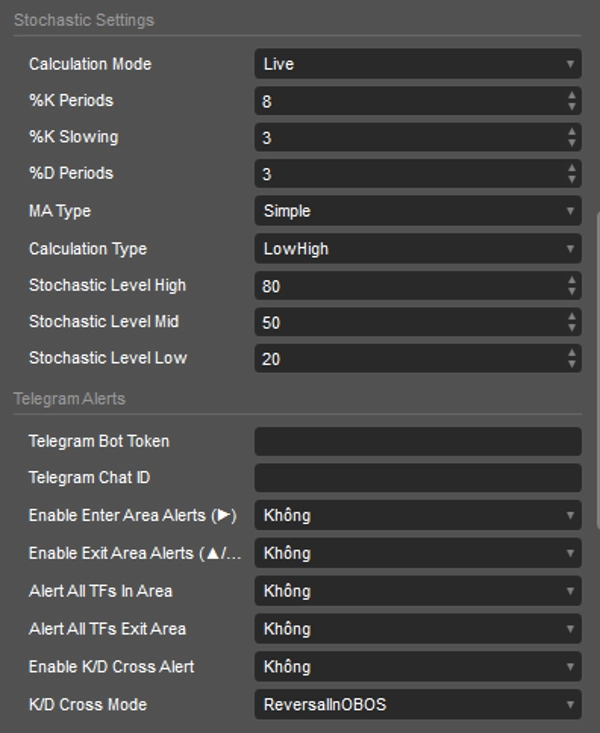
Symbols List(comma-separated) andTimeframes List. Set theToggle Dashboard Hotkey(default is 'H'). - Stochastic Settings: Fully customize the
%K Periods,%K Slowing,%D Periods, andMA Typeto match your strategy. Adjust OB/OS limits viaStochastic Level HighandStochastic Level Low. - Telegram Alerts: Input your
Telegram Bot TokenandChat ID. Toggle specific alert triggers such as Area Enter/Exit or K/D Cross Mode (Reversal, Continuation, Neutral Zone, etc.).
Symbols & Colors Explanation
- Colors:
- Dark Green Background: Symbol is in the Overbought area.
- Dark Red Background: Symbol is in the Oversold area.
- Aqua / Orange Text: Indicates whether the Stochastic value is currently Rising (Aqua) or Falling (Orange).
- Symbols:
- ▶ (Enter): Price is entering the Overbought or Oversold zone.
- ▲ (Exit Low): Price is exiting the Oversold zone upwards.
- ▼ (Exit High): Price is exiting the Overbought zone downwards.
- ↗ (Cross Up): %K line has crossed above the %D line.
- ↘ (Cross Down): %K line has crossed below the %D line.
The HIO Multi-Currency Stochastic Scanner is a robust workflow enhancement tool for technical traders. By centralizing crucial momentum data, it provides a clearer macro perspective of the market, helping you make informed decisions without the chart clutter.
Summary
Indicator profile
Indicator category
Momentum
Output type
Visualisation
Signals
Filter
Data requirements
Bars only
Tick data
Volume
Supported signals
Cross
Reversal
Volatility
Trend strength
Divergence
Level break
Level touch
Customer reviews
4.5
Reviews: 2
5 | 50 % | |
4 | 50 % | |
3 | 0 % | |
2 | 0 % | |
1 | 0 % |
Customer reviews
May 20, 2026
a calm trader gets value from timing feels less random, and two sessions say more than one clean chart.
May 17, 2026
A 5 minute check should not become a 30 minute rabbit hole. It supports the idea without replacing judgment.
Discussion
FAQ
Volume
Stochastic
Products available through cTrader Store, including trading bots, indicators and plugins, are provided by third-party developers and made available for informational and technical access purposes only. cTrader Store is not a broker and does not provide investment advice, personal recommendations or any guarantee of future performance.
More from this author


!["[Hamster-Coder] Pivot Points MTF" logo](https://cdn.ctrader.com/image/webp/4c143e5a-309c-40e3-a578-f04d1e133ffa_31159)


Price
Since 12/06/2025
1
Sales
316
Free installs