
(ViPi) MTF Candles
Indicator
106 downloads
Version 1.0, Feb 2026
Windows, Mac
Description
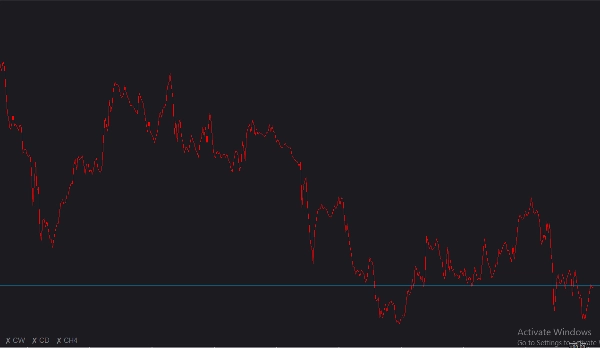
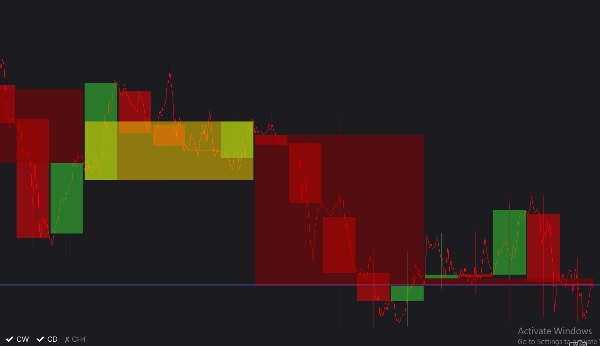
Detailed Introduction (ViPi) MTF Candles is a highly interactive, customizable charting tool designed to give traders a top-down market perspective without ever leaving their active chart. By seamlessly overlaying up to three distinct higher timeframe (MTF) candles directly onto your current view, you can easily spot macroeconomic trends, key support/resistance levels, and market shifts at a glance. It features a sleek, non-intrusive on-chart toggle menu that allows you to instantly hide or reveal each timeframe, ensuring your workspace remains clean and focused.
Full Parameters List
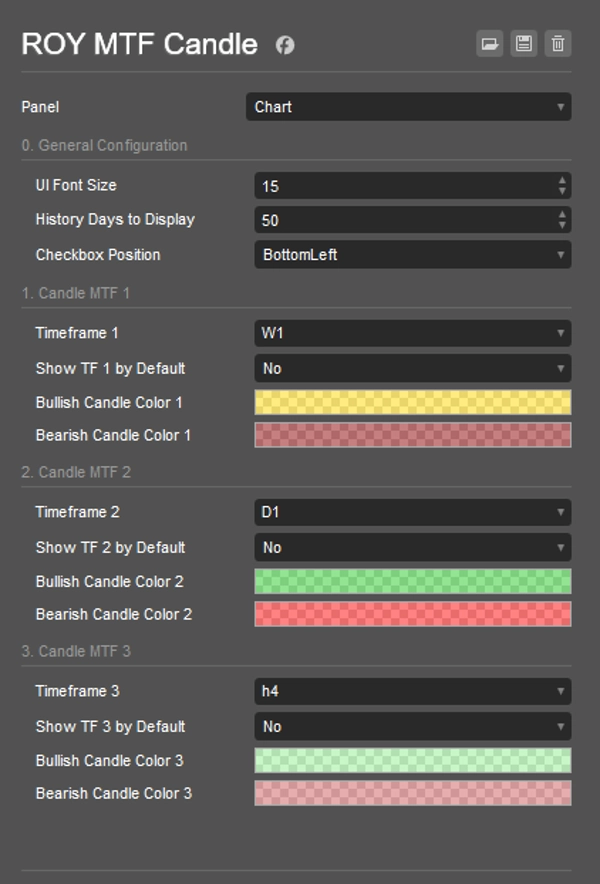
- UI Font Size: Adjusts the text size for the on-chart interactive toggle buttons. Can be set between 8 and 30 (Default: 11).
- History Days to Display: Determines how many days back the indicator will draw the historical MTF candles (Default: 50 days).
- Checkbox Position: Lets you anchor the UI toggle menu to any corner of your chart: TopLeft, TopRight, BottomLeft, or BottomRight (Default: BottomLeft).
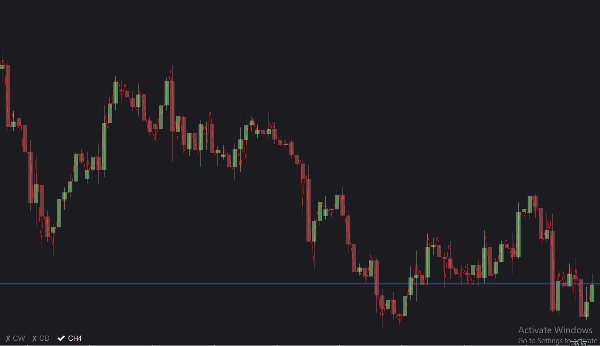
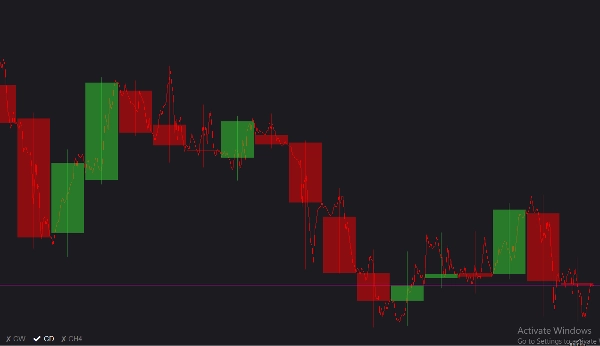
- Timeframe 1, 2, 3: The specific higher timeframes you wish to monitor. (Defaults are Weekly, Daily, and Hour4 respectively).
- Show TF 1, 2, 3 by Default: Toggles whether each timeframe's candles are visible immediately when the indicator is applied to the chart (Default: False).
- Bullish/Bearish Candle Colors: Allows complete customization of the up and down candle colors for each of the three timeframes, complete with transparency support to avoid obscuring your main chart.
Usage Guide
- Attach to Chart: Load the (ViPi) MTF Candles indicator onto your active cTrader workspace.
- Configure Timeframes: Open the settings and select up to three macro timeframes (e.g., Weekly, Daily, and H4) you want to monitor alongside your current timeframe.
- Customize Visuals: Adjust the colors and transparency for each timeframe's bullish and bearish candles so they contrast nicely with your background.
- Toggle Visibility on the Fly: Use the convenient on-chart interactive buttons (located at the Checkbox Position you chose) to quickly click and toggle specific MTF overlays on or off as you perform your analysis.
Summary
AI summary
(ViPi) MTF Candles is a charting indicator for cTrader that overlays up to three higher timeframe (multi-timeframe, MTF) candlestick charts directly onto the current chart. This tool enables traders to analyze broader market trends, key support and resistance levels, and shifts in market sentiment without switching charts. Users can customize the displayed timeframes—commonly Weekly, Daily, and 4-hour—and adjust the number of historical days shown. The indicator includes an on-chart toggle menu, which can be positioned in any corner of the chart, allowing quick visibility control of each timeframe overlay. Visual customization options include adjustable font sizes for toggle buttons and configurable bullish/bearish candle colors with transparency settings to maintain chart clarity. This facilitates a streamlined, interactive top-down market perspective suitable for various markets including Forex, indices, commodities, stocks, and cryptocurrencies.
Indicator profile
Customer reviews
0.0
Reviews: 0
Customer reviews
No reviews for this product yet. Already tried it? Be the first to tell others!
Discussion
FAQ
BTCUSD
Forex
Indices
EURUSD
Commodities
GBPUSD
NZDUSD
Crypto
Stocks
XAUUSD
NAS100
USDJPY
Products available through cTrader Store, including trading bots, indicators and plugins, are provided by third-party developers and made available for informational and technical access purposes only. cTrader Store is not a broker and does not provide investment advice, personal recommendations or any guarantee of future performance.
More from this author


Price
Since 12/06/2025
1
Sales
336
Free installs