
HIO RSI Multi Currency Scanner Pro
Indicator
Version 1.1, May 2026
Windows, Mac
4.7
Reviews: 4

Since 12/06/2025
1
Sales
448
Free installs
Description
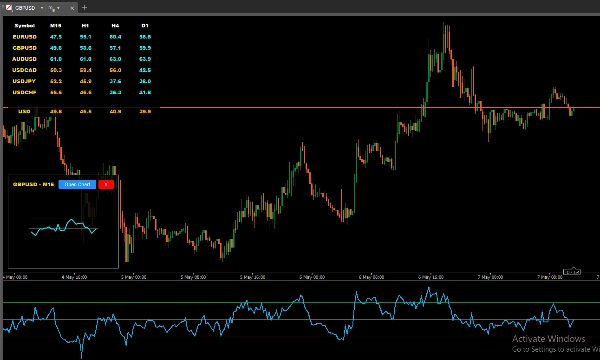
The HIO RSI Multi Currency Scanner Pro is an analytical dashboard designed to help you monitor market momentum. Instead of switching between multiple charts, this tool provides a consolidated view to track RSI levels across various symbols and timeframes simultaneously. It is built to assist traders in identifying market conditions efficiently.
Key Features
- Currency Strength Integration: Calculates the weighted strength of a target currency based on RSI and volume across selected pairs.
- Interactive Mini-Charts: Click any data cell to view an instant popup mini-chart of the RSI history without leaving your current workspace.
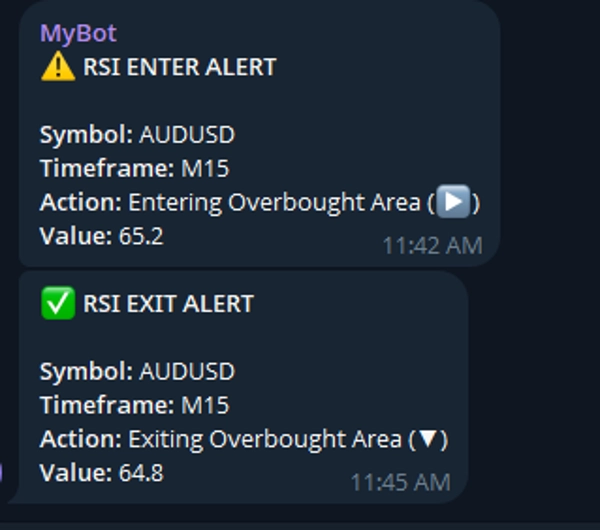
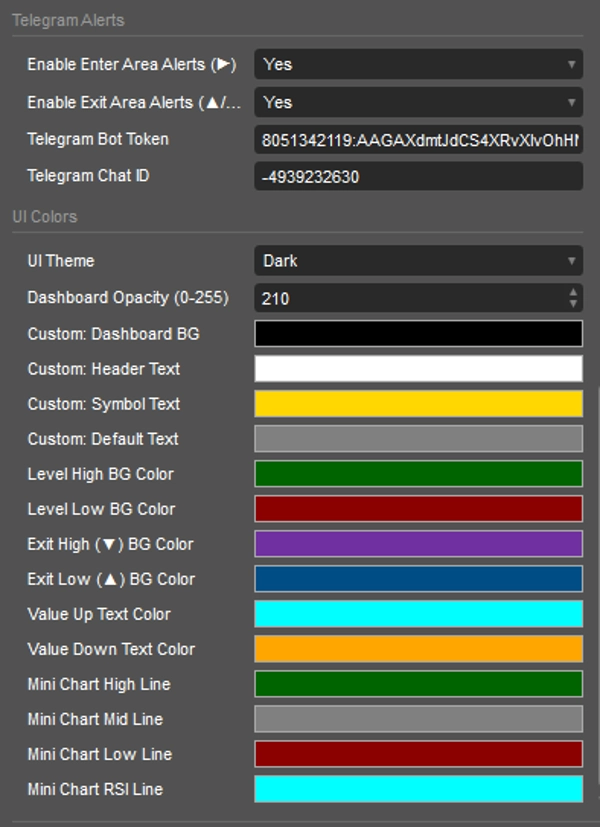
- Smart Alerts: Get notified when RSI enters or exits specific extreme zones via messaging integration.
- Dual Calculation Modes: Choose between Live for real-time tracking or BarClose for updates upon candle close.
- Customizable UI: Support for Dark, Light, and Custom themes with adjustable opacity and a dedicated hotkey to toggle dashboard visibility.
Visual Alerts & Color Logic
The dashboard uses an intuitive color-coding system to help you read market conditions quickly:
- Background Colors (Zones):
- Dark Green / Dark Red: RSI is currently in the Overbought / Oversold zone.
- Purple / Blue: RSI has just exited the Overbought / Oversold zone.
- Text Colors (Momentum): Aqua / Orange: The RSI value is rising / falling compared to the previous candle.
- Directional Indicators: Text updates dynamically to indicate if RSI is entering or exiting the zones.
(Note: UI and text colors are fully customizable via the settings)
Setup & Parameters
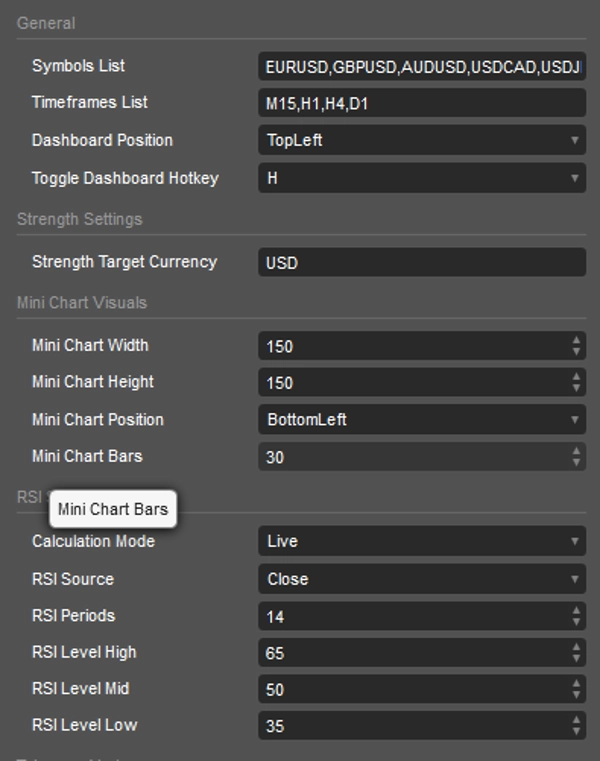
- General: Define your Symbols List and Timeframes List. Set the Dashboard Position and your preferred Hotkey.
- RSI Core: Adjust RSI Periods, select the RSI Source, and set specific thresholds for High, Mid, and Low levels.
- Strength Settings: Input your Target Currency to monitor its overall momentum.
- Notifications: Input your settings to enable remote notifications for Enter or Exit alerts.
Elevate your trading routine with a tool designed for clarity. The HIO RSI Multi Currency Scanner Pro is built to optimize your multi-asset monitoring process.
Summary
AI summary
The HIO RSI Multi Currency Scanner Pro is an analytical dashboard designed for monitoring Relative Strength Index (RSI) levels across multiple symbols and timeframes simultaneously. It consolidates market momentum data into a single interface, reducing the need to switch between charts. Key features include currency strength integration, which calculates weighted strength of a target currency based on RSI and volume across selected pairs. The tool offers interactive mini-charts accessible via clickable data cells, enabling quick RSI history review without leaving the workspace. It supports smart alerts that notify users when RSI enters or exits specified extreme zones through messaging integration. Users can select between live real-time tracking or updates upon candle close with dual calculation modes. The customizable user interface supports dark, light, and custom themes, adjustable opacity, and a hotkey to toggle dashboard visibility. Visual alerts use color-coded backgrounds and text to indicate RSI zones and momentum changes, with full customization available. Setup options allow defining symbols and timeframes, adjusting RSI parameters, setting target currencies for strength monitoring, and configuring remote notifications. This tool is intended to streamline multi-asset RSI monitoring for traders seeking a comprehensive momentum overview.
Indicator profile
Indicator category
Momentum
Output type
Visualisation
Signals
Filter
Data requirements
Bars only
Tick data
Volume
Supported signals
Cross
Reversal
Discussion
Customer reviews
4.7
Reviews: 4
5 | 75 % | |
4 | 25 % | |
3 | 0 % | |
2 | 0 % | |
1 | 0 % |
Customer reviews
May 20, 2026
A 12 trade note set is enough for first impressions. It keeps the review from getting sloppy.
May 18, 2026
ngl, timing feels less random and that is enough to keep testing it. M15 is enough for the first pass.
May 15, 2026
No reason to yolo this live without a few normal sessions. It needs a few bad trades in the sample too.
FAQ
RSI
Volume
Products available through cTrader Store, including trading bots, indicators and plugins, are provided by third-party developers and made available for informational and technical access purposes only. cTrader Store is not a broker and does not provide investment advice, personal recommendations or any guarantee of future performance.
More from this author




















Price
Since 12/06/2025
1
Sales
448
Free installs