
HIO Mutil Currency CCI Scanner
Indicator
Version 1.0, May 2026
Windows, Mac
4.5
Reviews: 2
Description
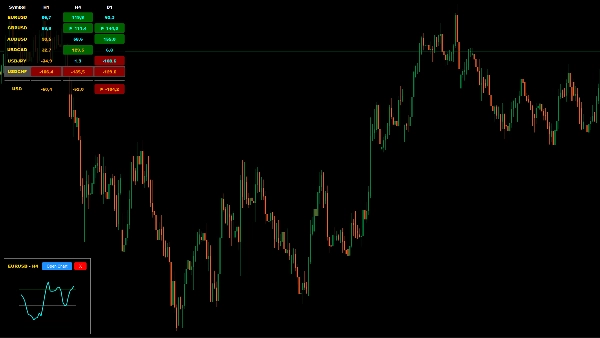
The HIO Multi-Currency CCI Scanner is a custom cTrader indicator designed to optimize your trading workspace. Instead of navigating between multiple open charts, this indicator provides a centralized dashboard to monitor Commodity Channel Index (CCI) values across multiple symbols and timeframes simultaneously. It is built to assist traders in identifying potential market extremes and trend continuations from a single panel.
Key Features
- Multi-Symbol & Timeframe Matrix: Monitor user-defined symbols and timeframes within a single, unified panel on your cTrader chart.
- Currency Strength Calculation: Features an integrated meter that estimates target currency strength using a volume-weighted CCI algorithm.
- Interactive Mini-Charts: Click on any data cell within the dashboard to open a floating mini-chart, allowing you to view the detailed CCI line without leaving your main workspace.
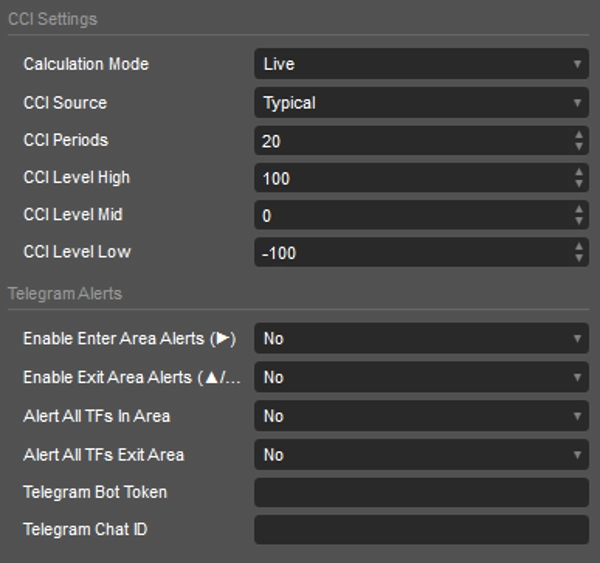
- Integrated Telegram Alerts: Connect your Telegram Bot to receive notifications when individual timeframes—or a confluence of all timeframes—enter or exit your predefined extreme zones.
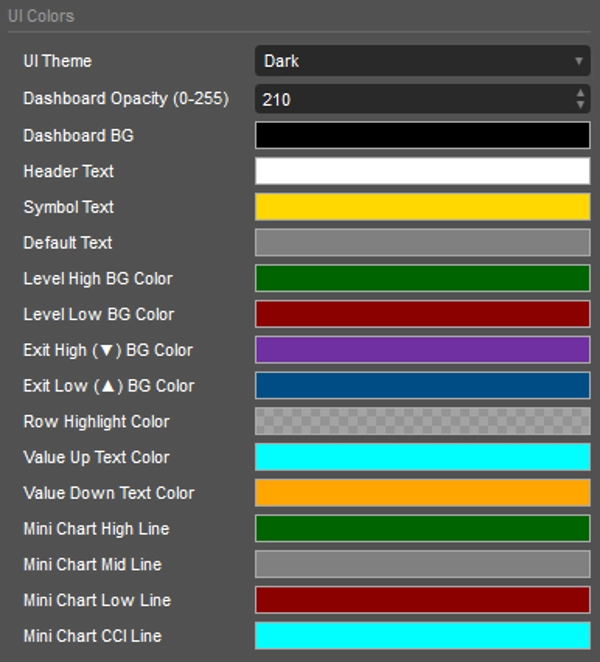
- Customizable UI: Fully adaptive design with Light, Dark, or Custom color themes to integrate seamlessly with your preferred cTrader environment.
Setup & Parameters
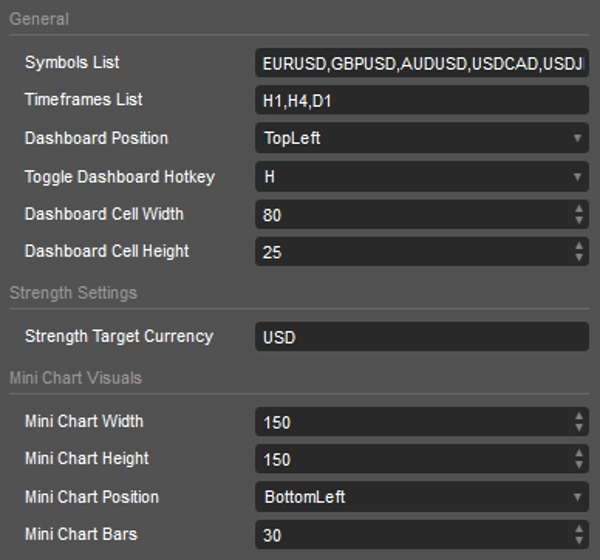
- Symbols & Timeframes: Input your desired assets and timeframes using comma-separated values (e.g., EURUSD, GBPUSD and h1, h4, d1).
- Target Currency: Define the base currency (e.g., USD) for the strength meter calculations.
- CCI Settings: Customize core parameters including Calculation Mode (Live/Bar Close), Data Source (e.g., Close, High, Low), Periods, and specific Overbought/Oversold thresholds.
- Alert Configuration: Input your Telegram Bot Token and Chat ID to enable remote push notifications.
Dashboard Legend (Colors & Symbols)
The dashboard uses visual cues to quickly convey momentum data:
- Dark Green Background: CCI is currently resting in the Overbought zone.
- Dark Red Background: CCI is currently resting in the Oversold zone.
- Purple/Blue Backgrounds: CCI is actively crossing back out of an extreme zone.
- ▶ (Enter): Momentum is actively entering an extreme threshold.
- ▼ (Down/Exit): Exiting the Overbought area, indicating potential downside momentum.
- ▲ (Up/Exit): Exiting the Oversold area, indicating potential upside momentum.
Note: This tool is designed for analytical purposes to assist with your technical analysis workflow within cTrader.
Summary
Indicator profile
Indicator category
Momentum
Output type
Visualisation
Signals
Filter
Data requirements
Bars only
Tick data
Volume
Supported signals
Cross
Divergence
Trend strength
Volatility
Level touch
Level break
Reversal
Customer reviews
4.5
Reviews: 2
5 | 50 % | |
4 | 50 % | |
3 | 0 % | |
2 | 0 % | |
1 | 0 % |
Discussion
FAQ
Volume
CCI
Products available through cTrader Store, including trading bots, indicators and plugins, are provided by third-party developers and made available for informational and technical access purposes only. cTrader Store is not a broker and does not provide investment advice, personal recommendations or any guarantee of future performance.
More from this author


Price
Since 12/06/2025
1
Sales
316
Free installs