
Opis
Signal Strike to profesjonalny wskaźnik handlowy zaprojektowany dla ctrader, który dostarcza wyraźne, wysokozaufane sygnały wejścia bezpośrednio na wykresie. Zbudowany z zaawansowaną logiką łączącą trend, momentum, zmienność i potwierdzenie wolumenu, to narzędzie pomaga traderom z pewnością identyfikować precyzyjne okazje do KUPNA i SPRZEDAŻY.
W przeciwieństwie do ogólnych wskaźników, Signal Strike jest zaprojektowany tak, aby filtrować świece niezdecydowania i słabe ustawienia. Gdy warunki się zgadzają, wskaźnik rysuje poziomy wejścia, stop loss i take profit bezpośrednio na wykresie, wraz z procentem pewności. Jeśli nie zostanie wykryte żadne ważne ustawienie, wskaźnik wyświetli „Brak ważnego sygnału KUPNA/SPRZEDAŻY” na górze wykresu — dzięki czemu zawsze wiesz dokładnie, kiedy działać, a kiedy się wycofać.
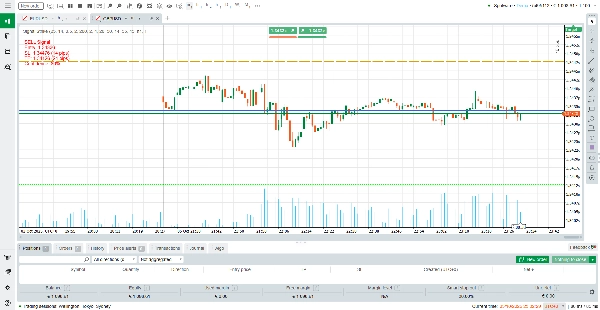
W Signal Strike każdy kolor linii ma jasne znaczenie, które pomaga traderom natychmiast odczytać wykres. Linia wejścia jest rysowana na niebiesko, oznaczając dokładną cenę, przy której aktywowane jest ustawienie handlowe. Linia Stop Loss pojawia się na pomarańczowo, pokazując poziom ochronny, na którym transakcja zostanie zamknięta, jeśli rynek pójdzie przeciwko Tobie.
Linia Take Profit jest wyświetlana w jasnozielonym kolorze, podkreślając poziom docelowy, na którym zabezpieczane są zyski. Dla jasności kierunkowej sygnały KUPNA są podkreślone na zielono, podczas gdy sygnały SPRZEDAŻY na czerwono. Te mocne, nasycone kolory zapewniają, że każdy element wyróżnia się, ułatwiając szybkie rozróżnienie stref wejścia, ryzyka i nagrody.
Jak czytać sygnały
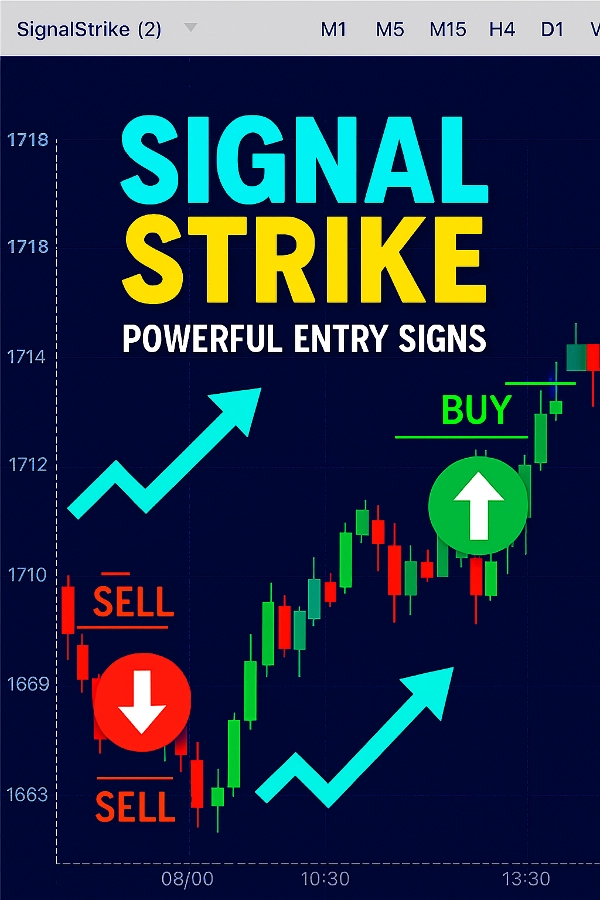
Sygnał KUPNA: Pojawia się zielona strzałka w górę i etykieta, pokazujące cenę wejścia, stop loss, take profit oraz poziom pewności.
Sygnał SPRZEDAŻY: Pojawia się czerwona strzałka w dół i etykieta z tymi samymi szczegółami.
Brak sygnału: Jeśli warunki rynkowe nie są wystarczająco silne, wskaźnik wyświetla „Brak ważnego sygnału KUPNA/SPRZEDAŻY” na górze wykresu.
Dynamiczne TP/SL: Poziomy take profit i stop loss są automatycznie dostosowywane na podstawie zmienności i warunków RSI.
Aby zmaksymalizować wyniki, zaleca się przełączanie między interwałami czasowymi (M1, M5, M15, H1, H4), aby znaleźć najczystsze sygnały dla swojego stylu handlu.
Jak działa wskaźnik
Signal Strike łączy wiele warstw analizy:
Wykrywanie trendu.
Filtr momentum.
Sprawdzenie zmienności.
Potwierdzenie wolumenu.
Filtr niezdecydowania – małe, słabe świece są ignorowane, aby uniknąć fałszywych wejść.
Tylko gdy te warunki się zgadzają, wskaźnik generuje sygnał KUPNA lub SPRZEDAŻY. Zapewnia to, że każdy sygnał jest poparty wieloma potwierdzeniami, co zmniejsza szumy i poprawia dokładność.
Kluczowe cechy (5 najważniejszych)
Wyraźne poziomy wejścia, SL i TP – natychmiast widoczne na wykresie.
Procent pewności – poznaj siłę każdego sygnału przed wejściem.
Wsparcie wielu interwałów czasowych – działa na wszystkich interwałach od M1 do H4.
Automatyczne filtrowanie – unika fałszywych sygnałów podczas niezdecydowania lub okresów niskiego wolumenu.
Przyjazne etykiety – łatwe do odczytania, z wyświetlaniem „Brak sygnału” gdy warunki nie są spełnione.
Zalecane ustawienia według interwału czasowego
Wskaźnik zawiera elastyczne parametry (LookbackCandles, ATRPeriod, ATRMultiplier, okresy SMA, poziomy RSI itp.). Poniżej znajdują się zoptymalizowane ustawienia dla różnych stylów handlu:
M1 (Skalpowanie)
LookbackCandles: 20
ATRPeriod: 10
ATRMultiplier: 0.4
SMA szybki/wolny: 10 / 30
RSI: 12 (Kupno > 55, Sprzedaż < 45) → Najlepsze dla ultra-krótkich skalpów z szybkimi wejściami.
M5 (Szybki intraday)
LookbackCandles: 25
ATRPeriod: 14
ATRMultiplier: 0.5
SMA szybki/wolny: 20 / 50
RSI: 14 (Kupno > 55, Sprzedaż < 45) → Zrównoważone dla krótkich transakcji intraday.
M15 (Swing intraday)
LookbackCandles: 30
ATRPeriod: 14
ATRMultiplier: 0.6
SMA szybki/wolny: 20 / 60
RSI: 14 (Kupno > 56, Sprzedaż < 44) → Idealne do łapania średnich ruchów intraday.
H1 (Swing trading)
LookbackCandles: 40
ATRPeriod: 20
ATRMultiplier: 0.7
SMA szybki/wolny: 30 / 80
RSI: 14 (Kupno > 57, Sprzedaż < 43) → Silniejsze filtry dla wyższych interwałów swingowych.
H4 (Trading pozycyjny)
LookbackCandles: 50
ATRPeriod: 20
ATRMultiplier: 0.8
SMA szybki/wolny: 50 / 100
RSI: 14 (Kupno > 58, Sprzedaż < 42) → Najlepsze dla długoterminowych, wysokozaufanych wejść.
Dlaczego warto wybrać Signal Strike?
Signal Strike to nie tylko kolejny wskaźnik — to narzędzie do podejmowania decyzji, które oszczędza czas, zmniejsza niepewność i pomaga traderom skupić się na najlepszych okazjach. Niezależnie od tego, czy jesteś skalperem na M1, czy traderem swingowym na H4, Signal Strike dostosowuje się do Twojego stylu i dostarcza potężne sygnały wejścia z jasnością i precyzją.
Przejmij kontrolę nad swoim handlem z Signal Strike i doświadcz różnicy handlu z pewnością.
Podsumowanie
When a valid trade setup occurs, Signal Strike plots entry, stop loss, and take profit levels on the chart, each color-coded for clarity: blue for entry, orange for stop loss, and lime green for take profit. BUY signals are marked with green arrows and labels, while SELL signals use red. A confidence percentage accompanies each signal to indicate its strength. If no valid setup is detected, a “No valid BUY/SELL signal” message appears.
The indicator supports multiple timeframes from M1 to H4, with recommended settings optimized for scalping, intraday, swing, and position trading styles. Take profit and stop loss levels adjust dynamically based on volatility and RSI conditions. Signal Strike aims to assist traders in making informed decisions by highlighting clear entry points, risk levels, and profit targets across various markets including Forex, commodities, crypto, and stocks.
Opinie klientów
5 | 50 % | |
4 | 0 % | |
3 | 50 % | |
2 | 0 % | |
1 | 0 % |


![Logo „[CB] Pivot Points Pro”](https://cdn.ctrader.com/image/webp/43463c82-67b0-4f10-a4ba-901bba091d81_32594)


