
TradingViewMACD
Wskaźnik
3 zakupy
Wersja 1.0, Feb 2025
Windows, Mac
5.0
Opinie: 1

Opis
Wskaźnik TradingViewMACD
Ulepsz swoją strategię handlową dzięki naszemu wysoce konfigurowalnemu wskaźnikowi TradingViewMACD, zaprojektowanemu dla platformy cAlgo. To potężne narzędzie łączy elastyczność i precyzję potrzebną do optymalizacji analizy rynku.
Kluczowe cechy:
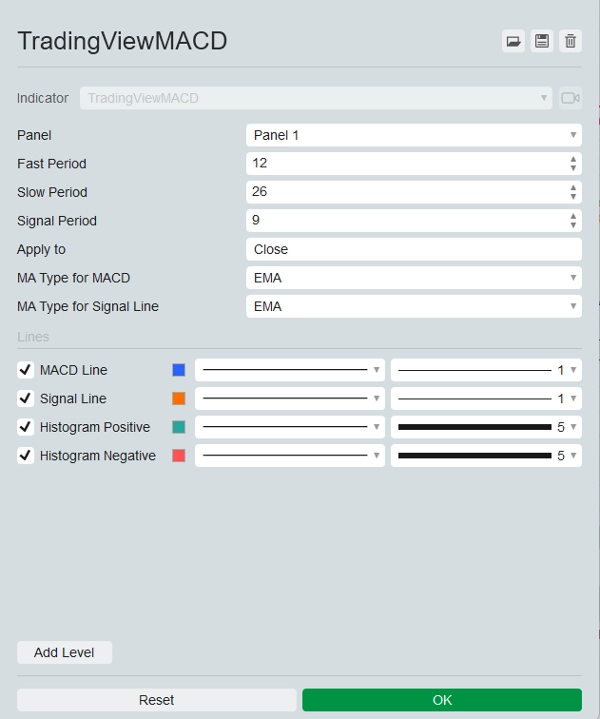
- Konfigurowalne parametry:
-
- Okres szybki: Dostosuj okres szybkiej średniej kroczącej do swojego stylu handlu.
- Okres wolny: Skonfiguruj okres wolnej średniej kroczącej dla zwiększenia dokładności sygnałów.
- Okres sygnału: Ustaw okres linii sygnału, aby precyzyjnie dostosować punkty wejścia i wyjścia.
- Zastosowana cena: Wybierz spośród cen otwarcia, najwyższej, najniższej, zamknięcia, mediany, typowej lub ważonej, aby zastosować wskaźnik.
- Wiele typów średnich kroczących:
-
- Wybierz pomiędzy prostą średnią kroczącą (SMA) a wykładniczą średnią kroczącą (EMA) zarówno dla linii MACD, jak i linii sygnału, zapewniając elastyczność w analizie.
- Wizualne wyjścia:
-
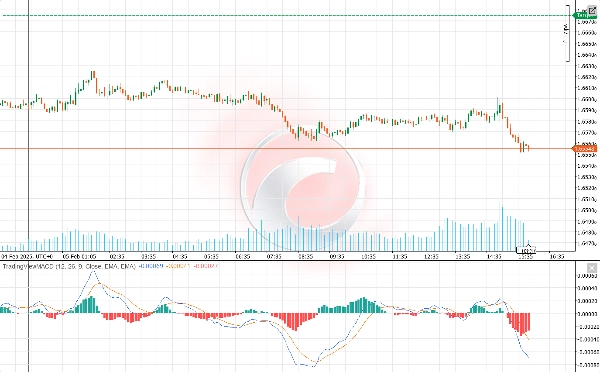
- Linia MACD: Wyświetlana w wyrazistym niebieskim kolorze dla wyraźnej widoczności.
- Linia sygnału: Podkreślona żywym pomarańczowym kolorem, aby łatwo odróżnić ją od linii MACD.
- Histogram: Rozróżnia wartości dodatnie i ujemne za pomocą odpowiednio zielonych i czerwonych kolorów, oferując wyraźną wizualną reprezentację momentum rynku.
- Ulepszone spostrzeżenia rynkowe:
-
- Wskaźnik oblicza różnicę między szybkimi i wolnymi średnimi kroczącymi, aby wygenerować linię MACD.
- Oblicza linię sygnału jako średnią kroczącą linii MACD.
- Histogram wizualnie przedstawia różnicę między linią MACD a linią sygnału, pomagając zidentyfikować potencjalne sygnały kupna i sprzedaży.
- Przyjazny dla użytkownika:
-
- Łatwy do zainstalowania i skonfigurowania, pozwalający traderom na każdym poziomie korzystać z jego zaawansowanych funkcji.
- Kompleksowa dokumentacja i wsparcie klienta zapewniające płynne doświadczenie.
Wykorzystaj pełny potencjał swojej strategii handlowej dzięki wskaźnikowi TradingViewMACD. Ulepsz swoją analizę rynku, podejmuj świadome decyzje i wyprzedzaj konkurencję dzięki temu niezbędnemu narzędziu handlowemu.
Podsumowanie
Podsumowanie AI
The TradingViewMACD indicator for the cAlgo platform is a customizable technical analysis tool designed to enhance market analysis. It calculates the difference between fast and slow moving averages to generate the MACD line, computes a signal line as the moving average of the MACD line, and displays a histogram representing the difference between these lines to help identify potential buy and sell signals.
Key features include adjustable parameters such as fast period, slow period, signal period, and applied price (open, high, low, close, median, typical, or weighted). Users can select between Simple Moving Average (SMA) and Exponential Moving Average (EMA) types for both the MACD and signal lines, providing analytical flexibility.
Visual outputs consist of a blue MACD line, an orange signal line, and a histogram with green and red colors indicating positive and negative momentum, respectively. The indicator is designed for ease of installation and configuration, supported by comprehensive documentation and customer support to accommodate traders of all experience levels.
Profil wskaźnika
Opinie klientów
5.0
Opinie: 1
5 | 100 % | |
4 | 0 % | |
3 | 0 % | |
2 | 0 % | |
1 | 0 % |
Opinie klientów
November 9, 2025
TradingView MACD brings the familiar feel straight to cTrader 🚀 - smooth, light, and 100% accurate to the original. Perfect for traders switching from TV who love clean momentum signals. Missing alerts, but flawless for classic trend and divergence play.
Dyskusja
Częste pytania
Signal
MACD
Produkty dostępne za pośrednictwem cTrader Store, w tym boty handlowe, wskaźniki i wtyczki, dostarczane są przez deweloperów zewnętrznych i udostępniane wyłącznie w celach informacyjnych oraz w celu zapewnienia dostępu technicznego. cTrader Store nie jest brokerem i nie zapewnia doradztwa inwestycyjnego, nie udziela spersonalizowanych rekomendacji ani nie gwarantuje przyszłych wyników.


Cena
Od 22/11/2024
140
Sprzedaż
2.61K
Bezpłatne instalacje