

🧠 Zaawansowany wskaźnik RSI – precyzyjna analiza momentum
Zyskaj głębszy wgląd w trendy rynkowe dzięki inteligentniejszemu RSI
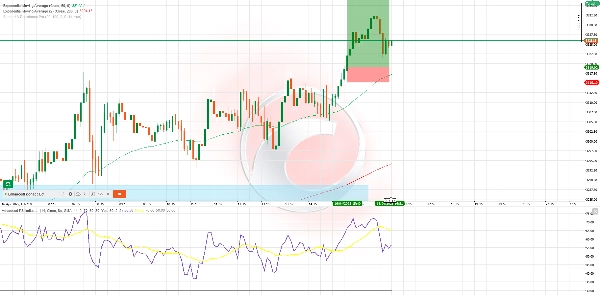
The Advanced RSI Indicator to potężna ewolucja klasycznego narzędzia RSI, stworzona dla traderów ceniących precyzję i inteligentne filtrowanie sygnałów. Dzięki zaawansowanemu wygładzaniu algorytmicznemu, adaptacyjnym strefom oraz zintegrowanemu wykrywaniu dywergencji, to narzędzie zapewnia dopracowaną analizę momentum dla wszystkich rynków i interwałów czasowych.
🔍 Kluczowe cechy:
✅ Wygładzona krzywa RSI
Redukuje niestabilne ruchy i fałszywe sygnały, zapewniając jaśniejszy wgląd w trendy rynkowe.
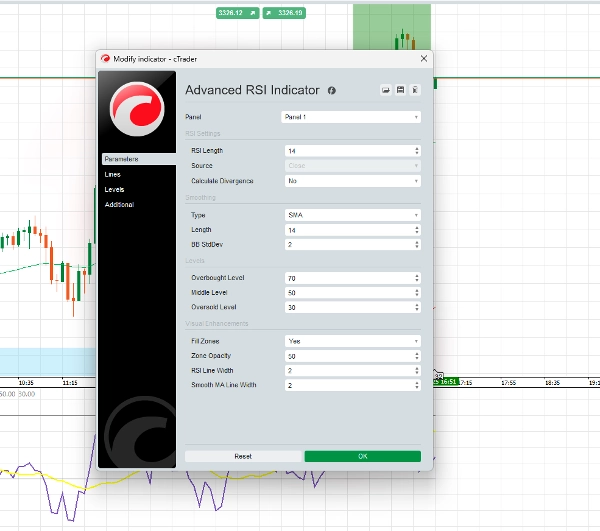
✅ Adaptacyjne strefy sygnałowe
Wykracza poza tradycyjne poziomy 70/30 dzięki dynamicznym progom reagującym na zmienność rynku.
✅ Kolorowe strefy momentum
Szybko oceniaj bycze lub niedźwiedzie momentum dzięki intuicyjnemu projektowi wizualnemu.
✅ Alerty dywergencji
Wyróżnia bycze i niedźwiedzie ustawienia dywergencji, wspierając podejmowanie strategicznych decyzji.
✅ Niestandardowy system alertów
Ustaw alerty na przekroczenia poziomów RSI i sygnały dywergencji, aby nigdy nie przegapić kluczowych momentów.
✅ Multi-aktywa, wielointerwałowy
Optymalizowany do użycia na rynku forex, kryptowalut, akcji, indeksów i innych — od wykresów M1 do dziennych.
⚙️ Przykład strategii – RSI Wave Ride
Najlepsze dla: transakcji swing na H1 i H4
Użyte wskaźniki: Advanced RSI, 50 EMA, 200 EMA
Przykład kupna:
- Cena jest powyżej 50 i 200 EMA
- RSI spada poniżej 40 i zaczyna rosnąć
- Pojawia się kolor byczego momentum
- (Opcjonalnie) Wykryto byczą dywergencję
- Wejście: zamknięcie świecy powyżej sygnału
- SL: poniżej ostatniego dołka swingowego
- TP: 1,5x–2x ryzyka lub ostatni opór
Przykład sprzedaży:
- Cena jest poniżej 50 i 200 EMA
- RSI przekracza 60, a następnie zaczyna spadać
- Kolor niedźwiedziego momentum potwierdza kierunek
- (Opcjonalnie) Niedźwiedzia dywergencja wzmacnia sygnał
- Wejście: zamknięcie świecy potwierdzającej
- SL: powyżej ostatniego szczytu swingowego
- TP: 1,5x–2x ryzyka lub ostatnie wsparcie
💬 Dlaczego traderzy wybierają to narzędzie:
- Przyjazne dla użytkownika, a jednocześnie potężne
- Sygnały nieprzemalowujące się
- Testowane na głównych rynkach
- Może być używane samodzielnie lub w połączeniu z innymi strategiami
5 | 100 % | |
4 | 0 % | |
3 | 0 % | |
2 | 0 % | |
1 | 0 % |


