present
Registrieren Sie sich und erhalten Sie $50 Rabatt auf Ihren ersten Kauf
Trading product for ApproachScope Indikator Key Levels ATR, image 1
ApproachScope
Indikator
18 downloads
Version 1.0, Jul 2026
Windows, Mac
5.0
Bewertungen: 1
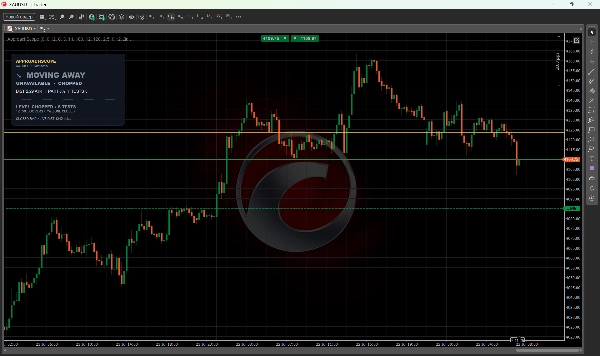
Trading product for ApproachScope Indikator Key Levels ATR, image 2
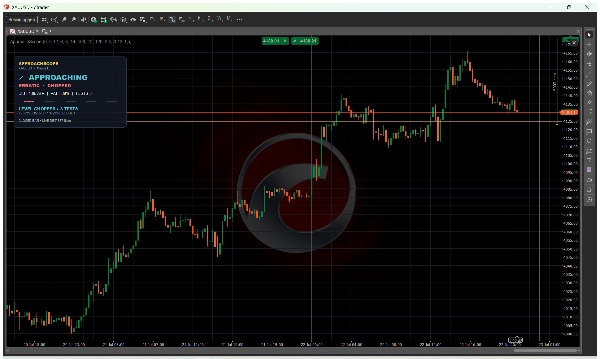
Trading product for ApproachScope Indikator Key Levels ATR, image 3
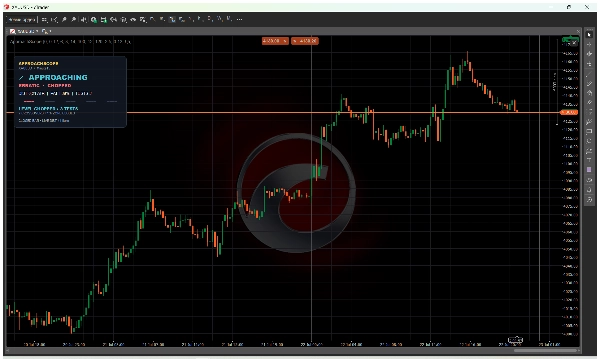
Trading product for ApproachScope Indikator Key Levels ATR, image 4
Trading product for ApproachScope Indikator Key Levels ATR, image 5
Seit 17/06/2026
113
Kostenlose Installationen

Beschreibung

🎯 SEHEN SIE, WIE DER PREIS IHR LEVEL ERREICHT


Wenn Sie bereits Ihre eigenen Unterstützungs- und Widerstandsniveaus markieren, wissen Sie, dass das Niveau selbst nur die halbe Geschichte ist. Auch die Art und Weise, wie der Preis es erreicht, ist wichtig.


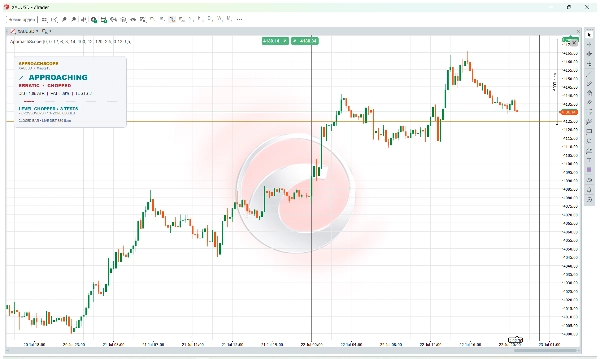
ApproachScope liest abgeschlossene Kerzen rund um das von Ihnen gewählte Niveau und verwandelt diese Bewegung in ein kompaktes Panel. Sie erhalten nützlichen Kontext für Ihre eigene Handelsentscheidung, nicht einen weiteren unerklärten Kauf- oder Verkaufspfeil.


📊 WAS DAS PANEL ZEIGT


• Marktstatus: WARTEN, ANNÄHERN, AM LEVEL oder WEGBEWEGEN

• Annäherungsstil: ORDNUNGSMÄSSIG, KOMPRIMIERT, IMPULSIV, UNBERECHENBAR oder GEMISCHT

• Level-Zustand: FRISCH, GETESTET, ABGENUTZT oder ZERHACKT

• Entfernung in ATR, Pfadeffizienz, Berührungsanzahl und aktueller Spread


🛠️ WIE MAN ES BENUTZT


1. Fügen Sie ApproachScope einem Chart hinzu.

2. Ziehen Sie die bernsteinfarbene Linie zu Ihrem Unterstützungs-, Widerstands-, Sitzungs-, Bereichs- oder höherem Zeitrahmenniveau.

3. Lesen Sie das Panel, während sich der Preis diesem Niveau nähert oder sich davon entfernt.


Die Berechnungen verwenden abgeschlossene Balken, sodass jeder Zustand leicht mit dem Chart überprüft werden kann. Jede Klassifikation enthält auch eine kurze Erklärung. Es gibt keine versteckte Wahrscheinlichkeitsbewertung.


👍 FÜR WEN ES GEEIGNET IST


ApproachScope ist für diskretionäre Intraday-Trader konzipiert, die bereits ihre eigenen Niveaus wählen und eine klarere Sicht auf die Annäherung wünschen. Es funktioniert mit Symbolen und Zeitrahmen, die gültige Preis- und Skalen-Daten liefern. Broker-Präfixe und -Suffixe für XAUUSD werden unterstützt.


⚙️ EINSTELLUNGEN


Sie können die ATR-Zonenbreite, Mindestzonengröße, Berührungsabstand, ATR- und Baseline-Perioden, Annäherungs- und Abnutzungsrückblicke, Spread-Warnung, Thema und Panelskalierung anpassen.


🔒 DATENSCHUTZ UND KONTROLLE


Der Indikator läuft lokal in cTrader ohne erhöhte Zugriffsrechte. Er verbindet sich nicht mit externen Servern, sammelt keine Kontohistorie und sendet keine Telemetriedaten. Er kann keine Trades öffnen, ändern oder schließen.


⚠️ BITTE BEACHTEN SIE


ApproachScope wählt keine Niveaus, generiert keine Kauf- oder Verkaufssignale, sagt keine Umkehr oder Ausbruch voraus, berechnet keine Gewinnwahrscheinlichkeit, setzt keinen TP oder SL und lädt keine Nachrichten.


ORDNUNGSMÄSSIG bedeutet nicht kaufen oder verkaufen. FRISCH garantiert keine Umkehr. ZERHACKT garantiert keinen Ausbruch. Ergebnisse hängen von Broker-Daten, Spread, Historie und Symbol-Einstellungen ab. Verwenden Sie immer Ihre eigene Bestätigung und Risikomanagement.

Zusammenfassung

KI-Zusammenfassung
ApproachScope is a trading indicator designed to provide context on how price approaches user-defined support and resistance levels. It analyzes completed candles around a selected level and displays a compact panel with detailed information to assist discretionary intraday traders in their decision-making process.

Key features of the panel include:
- Market state classification: WAITING, APPROACHING, AT LEVEL, or MOVING AWAY.
- Approach style identification: ORDERLY, COMPRESSED, IMPULSIVE, ERRATIC, or MIXED.
- Level condition status: FRESH, TESTED, WORN, or CHOPPED.
- Quantitative metrics such as distance in ATR (Average True Range), path efficiency, touch count, and current spread.

Users add ApproachScope to their chart and position an amber line on their chosen level (support, resistance, session, range, or higher timeframe). The indicator uses completed bars for calculations, ensuring transparency and easy verification against the chart. Each classification includes explanatory notes without relying on hidden probability scores.

Settings allow customization of ATR zone width, minimum zone size, touch separation, lookback periods, spread warnings, theme, and panel scale. The indicator operates locally within cTrader, does not connect to external servers, and does not execute trades. It supports symbols and timeframes with valid price and scale data, including broker prefixes and suffixes for XAUUSD.
Indikatorprofil

Kundenbewertungen

5.0
Bewertungen: 1
5
100 %
4
0 %
3
0 %
2
0 %
1
0 %
Kundenbewertungen
August 17, 2026
This one gives me clear context on how price reaches my levels without any arrows, signals and all that, just useful data like ATR distance and touch count. It's compact and doesnt clutter the chart, a no-brainer addition to my setup

Diskussion

Häufig gestellte Fragen (FAQ)

Key Levels
ATR
Support & Resistance
Über den cTrader Store verfügbare Produkte, einschließlich Handelsbots, Indikatoren und Plugins, werden von externen Entwicklern bereitgestellt und nur zu Informations- und technischen Zugriffszwecken verfügbar gemacht. cTrader Store ist kein Broker und erbringt keine Anlageberatung, persönlichen Empfehlungen oder eine Garantie für zukünftige Performance.

Mehr von diesem Autor

Indikator
ATR
Key Levels
+5
Gold chart overlay for XAUUSD: sessions, ADR zones, round levels, spread panel and sweep marks.
Indikator
Key Levels
Liquidity Grab
+2
A practical XAUUSD workspace for mapped levels, session context, liquidity events, alerts and risk planning.
Indikator
Volume
Account-wide discipline HUD that explains tilt patterns and compares Clean versus Flagged P&L in real time.

Das könnte Sie auch noch interessieren

Indikator
XAUUSD
Commodities
Draws support and resistance on all pairs. https://ctrader.com/products/748?u=SuperRay
Indikator
Signal
Stocks
+5
🚀 Automated Elliott Wave & Fibonacci tool for cTrader. Spot trends, corrections & retracements fast.
Indikator
SMC
Pro Volume Profile with Delta, Session Filters & CSV Export. Precision order flow analysis.
Indikator
ATR
Fibonacci
+1
Trading Clock Pro: An all-in-one market timing dashboard designed to help traders understand the market at one Spot.
Indikator
EMA
RSI
+2
Advanced TDI indicator with Shark Fin signals, chart arrows, MTF RSI, divergence detection and smart alerts.
Indikator
Advanced price action tool that combines multiple technical analysis concepts
Indikator
SMC
Prop
+15
Automatic Elliott Wave Detection with Professional Filters
Indikator
ATR
Prop
+5
Anchor volume profiles to pivots with POC, VAH, VAL and real-time insights for clearer trade decisions.
Indikator
Forex
EURUSD
+5
Smart Money Breakout Channels – Auto-detect breakout zones with price, volume & volatility insights on cTrader.
Indikator
ATR
EMA
+2
Eight-EMA ribbon with ATR trade zones, a nine-symbol screener and a five-timeframe trend dashboard.
Indikator
ATR
Forex
+5
A powerful ATR-based indicator generating clear BUY/SELL signals. Features real-time alerts and customizable sensitivity
Indikator
ATR
RSI
+5
Supply and demand zones with break of structure, higher timeframe MA signals, a percent stop and three targets.
Indikator
RSI
Forex
+12
Indicator pattern signal moment
Indikator
ADX
ATR
+5
EMA-cross signals scored on six confluence layers, with an ATR stop, three targets and a live panel
Indikator
Forex
BTCUSD
+9
🎯 Automatically identify significant breakouts from price consolidation zones.
Indikator
ATR
MSS
+5
Volume-based support and resistance boxes with breakout, hold, and structure shift signals for precise trading decisions
Indikator
ADX
ATR
+5
Scored breakouts of sloped pivot trendlines: four filters on the break bar, ATR stop, 1:1 / 1:2 / 1:3 targets, alerts.
Indikator
Forex
BTCUSD
+9
This indicator implements an Opening Range Breakout (ORB) trading strategy, designed to capture momentum during the most

Preis

Seit 17/06/2026
113
Kostenlose Installationen