
Opis
Zlecenie Klastra Płynności (LCO) 🔍💧
1. Co pokazuje LCO
Zlecenie Klastra Płynności automatycznie wykrywa i rysuje:
- Bycze klastry płynności (potencjalne strefy popytu / akumulacji) ✅
- Niedźwiedzie klastry płynności (potencjalne strefy podaży / dystrybucji) 🔻
Każdy klaster jest:
- zakotwiczony na słupku pivot wolumenu (lokalnym maksimum wolumenu),
- klasyfikowany jako byczy lub niedźwiedzi na podstawie ostatniego ruchu cenowego,
- rozciągnięty w przód w czasie aż cena zlikwiduje (skonsumuje) klaster.
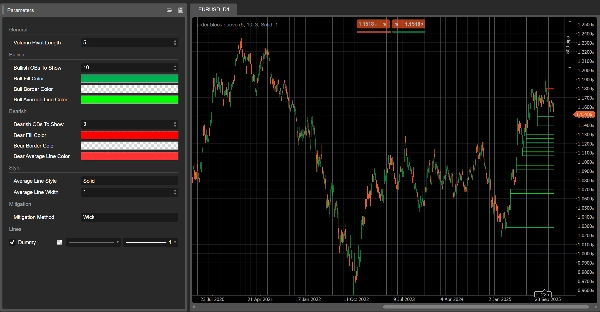
Na wykresie widzisz:
- Zielone prostokąty → bycze klastry płynności
- Czerwone prostokąty → niedźwiedzie klastry płynności
- Szara linia wewnątrz każdego prostokąta → średni poziom cenowy tego klastra
Gdy klaster jest uznany za zlikwidowany, znika z wykresu i pozostają tylko aktywne klastry.
2. Logika wykrywania (w prostych słowach)
- Pivot wolumenu
-
- LCO skanuje słupki, gdzie wolumen jest wyższy niż poprzednie i następne
Volume Pivot Lengthsłupki. - Te słupki to pivoty wolumenu – potencjalne kotwice dla klastrów płynności.
- LCO skanuje słupki, gdzie wolumen jest wyższy niż poprzednie i następne
- Kontekst: byczy vs niedźwiedzi
-
- Ostatnie zachowanie ceny definiuje kontekst:
-
- Byczy kontekst → dominowała rozciągnięcie w dół.
- Niedźwiedzi kontekst → dominowała rozciągnięcie w górę.
- Ten kontekst decyduje, czy następny pivot wolumenu stworzy byczy czy niedźwiedzi klaster płynności.
- Byczy klaster płynności
W byczym kontekście: -
- Dół klastra = minimum słupka pivot
- Góra klastra = środek słupka (
(high + low) / 2) - Interpretacja: strefa, gdzie presja spadkowa została wchłonięta i kupujący agresywnie weszli na rynek.
- Niedźwiedzi klaster płynności
W niedźwiedzim kontekście: -
- Dół klastra = środek słupka pivot
- Góra klastra = maksimum słupka pivot
- Interpretacja: strefa, gdzie presja wzrostowa została wchłonięta i sprzedający przejęli kontrolę.
- Linia średnia
-
- Dla każdego klastra LCO oblicza średnią z góry i dołu i rysuje szarą linię środkową.
- Działa to jako wewnętrzny poziom równowagi klastra.
- Likwidacja (konsumpcja klastra)
Na każdym nowym słupku LCO sprawdza, czy klaster jest zlikwidowany: -
- Dla byczych klastrów:
-
- Śledzi cenę docelową spadkową przez ostatnie
Volume Pivot Lengthsłupki: -
Metoda likwidacji = Knot→ najniższe minimum.Metoda likwidacji = Zamknięcie→ najniższe zamknięcie.
- Jeśli ta cena docelowa spadnie poniżej dołu klastra, klaster byczy jest uznawany za zlikwidowany i usuwany.
- Śledzi cenę docelową spadkową przez ostatnie
- Dla niedźwiedziych klastrów:
-
- Śledzi cenę docelową wzrostową:
-
Knot→ najwyższe maksimum.Zamknięcie→ najwyższe zamknięcie.
- Jeśli ta cena docelowa wzrośnie powyżej góry klastra, klaster niedźwiedzi jest zlikwidowany i usuwany.
Zlikwidowany = płynność w tym klastrze jest uznawana za skonsumowaną / unieważnioną.
3. Jak czytać LCO na wykresie
Zobaczysz głównie:
- Zielone klastry poniżej ceny → potencjalne strefy popytu płynności
- Czerwone klastry powyżej ceny → potencjalne strefy podaży płynności
Typowe odczytanie (nie jest to porada handlowa):
- Świeże klastry
-
- Niedawno utworzone klastry są często bardziej istotne:
-
- Byczy klaster poniżej ceny → obszar, gdzie kupujący ostatnio wchłonęli presję sprzedaży.
- Niedźwiedzi klaster powyżej ceny → obszar, gdzie sprzedający ostatnio wchłonęli presję kupna.
- Retesty klastra
-
- Cena wraca do byczego klastra z góry:
-
- Jeśli cena reaguje i utrzymuje dół → możliwy odbicie / strefa reakcji długiej pozycji.
- Cena wraca do niedźwiedziego klastra z dołu:
-
- Jeśli cena nie zdoła przebić góry → możliwa odrzut / strefa reakcji krótkiej pozycji.
- Zlikwidowane vs aktywne klastry
-
- Gdy cena przebija klaster poza jego granice zgodnie z wybraną metodą likwidacji,
→ ten klaster płynności jest usuwany na kolejnych słupkach. - Klastry nadal widoczne to aktywne strefy płynności, które nie zostały jeszcze w pełni przebite.
- Gdy cena przebija klaster poza jego granice zgodnie z wybraną metodą likwidacji,
- Używanie linii środkowej
-
- Ta szara linia środkowa może być używana jako:
-
- poziom realizacji zysków lub częściowego wyjścia wewnątrz klastra,
- referencja „uczciwej ceny” w strefie płynności,
- szybki sposób na sprawdzenie, czy cena handluje się w górnej czy dolnej połowie klastra.
4. Parametry (angielski)
Długość Pivot Wolumenu
- Słupki używane do:
-
- wykrywania pivotów wolumenu,
- obliczania ekstremów i celu likwidacji.
- Niższe wartości → więcej klastrów, więcej szumu;
- Wyższe wartości → mniej, ale bardziej znaczących klastrów.
Bycze Klastry Płynności Do Wyświetlenia
(dawniej Bycze OB Do Wyświetlenia)
- Maksymalna liczba byczych klastrów wyświetlanych na wykresie.
Niedźwiedzie Klastry Płynności Do Wyświetlenia
(dawniej Niedźwiedzie OB Do Wyświetlenia)
- Maksymalna liczba niedźwiedziych klastrów wyświetlanych.
Kolor Wypełnienia Byka / Kolor Wypełnienia Niedźwiedzia
- Kolor wypełnienia byczych/niedźwiedziych klastrów.
- Możesz uwzględnić wartości alfa (przezroczystość).
Kolor Linii Średniej Byka/Niedźwiedzia
- Kolor wewnętrznej linii środkowej dla każdego klastra.
Styl Linii Średniej
- Styl wizualny linii środkowej:
"Solid","Dashed","Dotted".
Grubość Linii Średniej
- Grubość linii środkowej.
Metoda Likwidacji
"Wick"→ likwidacja oparta na knotach high/low (bardziej czuła)."Close"→ likwidacja oparta na cenach zamknięcia (bardziej konserwatywna).
Podsumowanie
On the chart, bullish clusters appear as green rectangles below the price, indicating areas where buyers absorbed selling pressure. Bearish clusters are shown as red rectangles above the price, marking zones where sellers absorbed buying pressure. Each cluster includes a grey mid-line representing the average price level, serving as an internal equilibrium reference.
Clusters extend forward in time until price "mitigates" or consumes them, at which point they disappear, leaving only active liquidity zones visible. Mitigation is determined by tracking price extremes (high/low wicks or closing prices) over a configurable number of bars.
Key parameters include the volume pivot length (defining sensitivity and cluster significance), maximum clusters displayed, cluster colors, mid-line style, and mitigation method. LCO supports various markets including forex, indices, commodities, stocks, and cryptocurrencies, and integrates with multiple trading strategies and indicators such as RSI, MACD, Bollinger Bands, and Fibonacci levels.
Opinie klientów
5 | 100 % | |
4 | 0 % | |
3 | 0 % | |
2 | 0 % | |
1 | 0 % |


