Описание
NewsGuard – Наложение риска новостей с высоким воздействием — это профессиональный инструмент осведомленности о рисках для cTrader.
Он визуально выделяет временные окна вокруг основных экономических событий, которые известны тем, что вызывают экстремальную волатильность, расширение спреда и проскальзывание.
Вместо того чтобы реагировать после движения, NewsGuard предупреждает вас до увеличения риска.
Что показывает NewsGuard
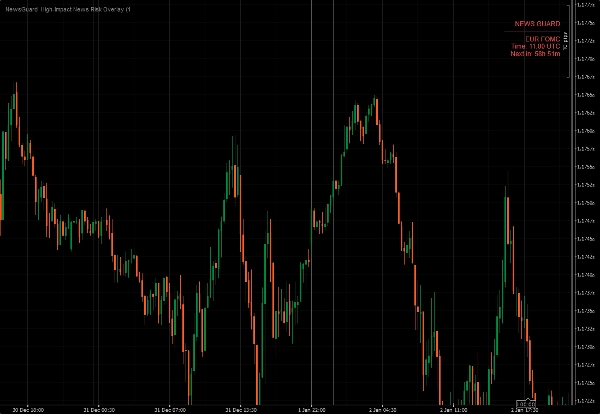
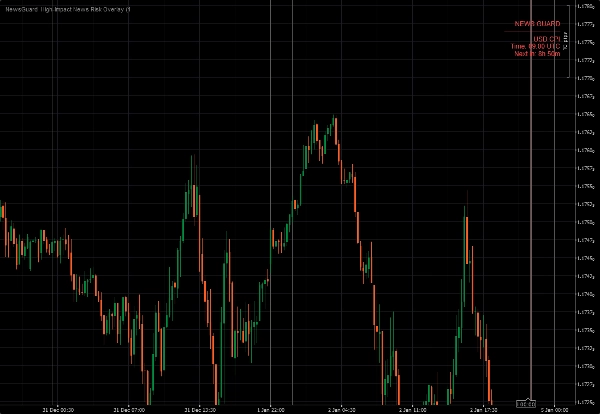
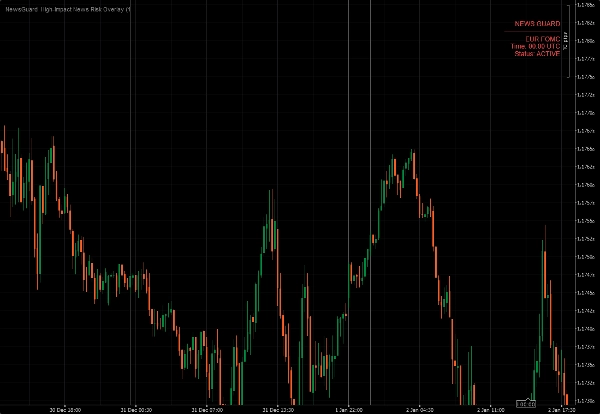
- Зоны риска новостей с высоким воздействием непосредственно на графике
- Регулируемое временное окно до и после каждого события
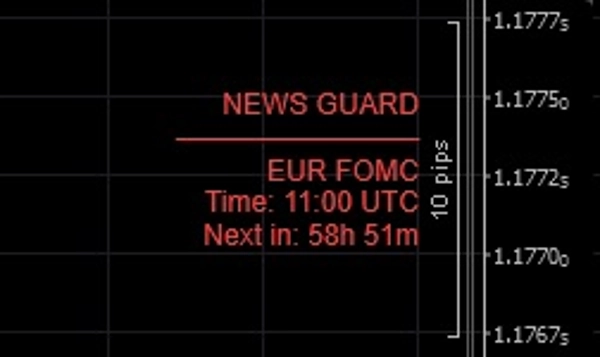
- Чистое наложение с информацией о предстоящих или активных новостях
- Автоматическая фильтрация релевантности на основе торгуемого символа
NewsGuard использует ручное расписание новостей с высоким воздействием, что делает его:
- надежным
- безопасным для хранения
- независимым от внешних источников или API
Чем NewsGuard НЕ является
- Не является новостной лентой
- Не предоставляет прогнозы
- Не дает торговых сигналов
Он существует с одной единственной целью:
делать вас осведомленными о рисках, связанных со временем.
Идеально подходит для скальперов, дневных трейдеров и всех, кто хочет избежать слепой торговли во время крупных новостных событий.
Сводка
Отзывы покупателей
5 | 100 % | |
4 | 0 % | |
3 | 0 % | |
2 | 0 % | |
1 | 0 % |