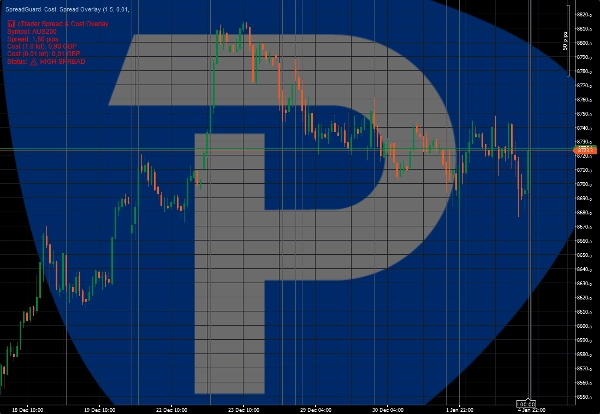
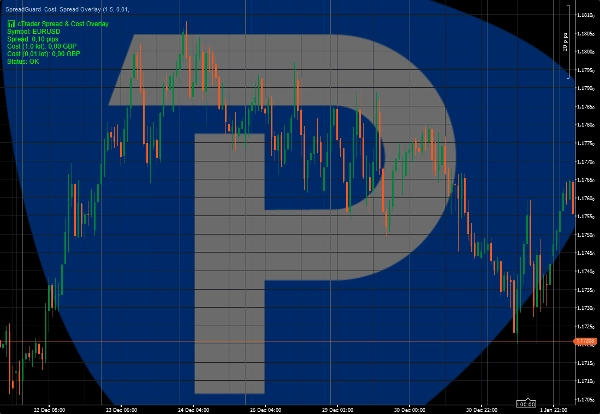
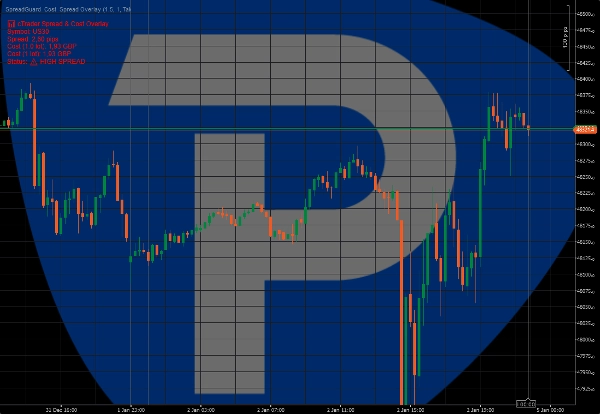
Logo „SpreadGuard  Cost  Spread Overlay”
SpreadGuard Cost Spread Overlay
Przesłany obraz „SpreadGuard  Cost  Spread Overlay”
Od 02/01/2026

cTrader Spread & Cost Overlay is a lightweight indicator designed to visualize real-time trading costs directly on the chart.

The indicator shows the current spread in pips and calculates the estimated cost of a trade based on the selected lot size. A visual warning highlights periods of high spread, helping traders avoid unfavorable execution conditions.

Key features:
• Live spread display (pips)
• Estimated trade cost for selected lot size
• Visual warning when spread exceeds a defined threshold
• Clean on-chart overlay

This indicator does not place trades or generate trading signals.
It is intended as an execution and risk-awareness tool for manual traders.

Suitable for scalpers, intraday traders, and prop firm accounts.

*Early access price. Future updates may be released at a higher regular price.

Indicator profile
0.0
Opinie: 0
Opinie klientów
Ten produkt nie ma jeszcze opinii. Wypróbowałeś(-aś) go już? Bądź pierwszy(-a) i powiedz o tym innym!
Prop
Forex
EURUSD
ATR
GBPUSD
Products available through cTrader Store, including trading bots, indicators and plugins, are provided by third-party developers and made available for informational and technical access purposes only. cTrader Store is not a broker and does not provide investment advice, personal recommendations or any guarantee of future performance.

Więcej od tego autora

Visual session structure showing Asia, London and New York high/low ranges directly on the chart.
Visual warning zones for high-impact news so you can manage risk before volatility hits.

Możesz także polubić

A long-term indicator created by E.S.C. Coppock
Stop Loss Pro – Precision Risk Management for Every Trader
Sero is a stochastic-based momentum oscillator that gives clear, color-coded visual signals for market momentum shifts.
VSA indicator analyzing volume, spread, and close location to detect supply/demand imbalances.
BB20 MULTICOLOR
The Zone Recovery indicator is used in an advanced hedging strategy, opening traders in the opposite direction.
Perfect Trend
Edge-aware clouds + Pro HUD: better entries, calmer exits, adaptive risk.
LudwigICT – Digital Root & IDR (cTrader Automate)
Visualize market asymmetry like never before — steady climbs meet sudden drops with the Donchian PSAR
SR Commander is a clean and intelligent support and resistance indicator for cTrader, built to help traders identify key
a visually very powerful tool for analyzing "opposing forces".
The Support & Resistance Pro helps traders identify key support and resistance levels for informed trading decisions.
Delta Peak Bubbles is a tick‑chart overlay for cTrader that highlights the strongest momentum spikes.
Chaikin money flow's primary purpose is to distinguish between periods of accumulation and distribution of a security.
🎯Automatically identifies the market's significant turning points (key H & L) and draws dynamic support and.....✍️
DailyLossGuard is a simple and practical cTrader indicator that monitors your total daily P/L in real time. It combines
Ride the wake of big banks. Boris Quantum Pulse tracks institutional gaps in real-time. Spot the flow, bank the profit.
Od 02/01/2026