
QX SessionBox ORB
Indicador
4 compras
Versión 1.0, Dec 2025
Windows, Mac
5.0
Valoraciones: 2
Descripción
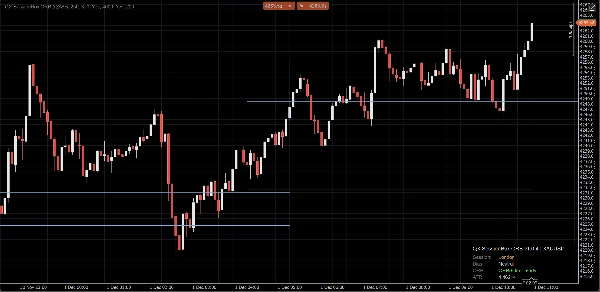
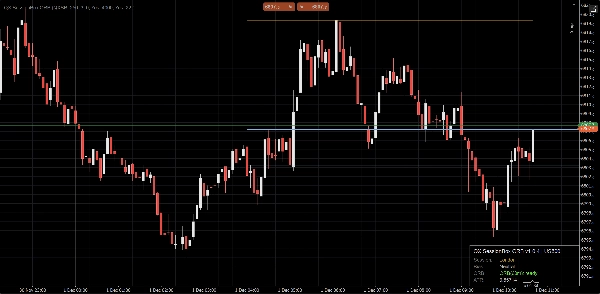
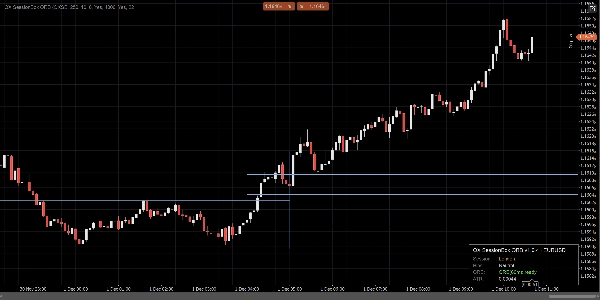
QX SessionBox ORB es una superposición limpia de sesión + Rango de Apertura (ORB) para cTrader.
Resalta Asia, Londres y NY con un mínimo desorden en el gráfico, construye el Rango de Apertura durante los primeros X minutos y mantiene visibles los niveles Alto/Bajo del ORB como estructura intradía objetiva. Un panel compacto muestra el estado de la sesión y la inclinación para que puedas leer el contexto en segundos.
Lo que obtienes
- Cajas de sesión Asia / Londres / NY (rangos de tiempo personalizados + colores)
- Rango de Apertura (ORB) para los primeros Minutos ORB
- Líneas Alto ORB / Bajo ORB (color, ancho y estilo personalizados)
- Caja ORB opcional (resaltado del rango)
- Panel compacto de tablero (estado de sesión, ORB, inclinación, ATR)
- Confirmaciones de ruptura opcionales (solo vela cerrada, estable)
Modo avanzado opcional
- Soporte para sesiones superpuestas (opcional)
-
- Dibuja múltiples cajas de sesión cuando los horarios se superponen
- Sesión primaria controla el panel, las señales y las líneas de referencia ORB (configurable)
Cómo usarlo (flujo de trabajo simple)
- Adjunta QX SessionBox ORB a tu gráfico.
- Configura Desfase UTC de la sesión para que coincida con tus horas de sesión previstas.
- Elige Minutos ORB (común: 15, 30, 60).
- Mientras se construye el ORB, el panel muestra construyendo. Después se vuelve listo.
- Usa los niveles ORB como estructura:
-
- Precio por encima del Alto ORB: presión alcista para la sesión
- Precio por debajo del Bajo ORB: presión bajista para la sesión
- Precio dentro del ORB: comportamiento de rango (el contexto importa)
- (Opcional) Activa Señales de trazado:
-
- SoloCruces (predeterminado): vela cierra más allá del límite ORB
- Estado: confirma cuando el precio transita a un estado alcista/bajista
- (Opcional) Activa Filtro ATR para reducir rupturas débiles (ATR k es tu control principal de sensibilidad).
Diseñado para gráficos reales
- Lógica de vela cerrada para estabilidad y claridad (sin parpadeo intrabar)
- Actualizaciones limitadas para menor uso de CPU
- Mantener últimas sesiones para evitar desorden
- Arranque de historial opción para poblar sesiones recientes rápidamente
- Comportamiento limpio del borde derecho (sin trucos de estiramiento del gráfico)
Notas
- Esta es una herramienta visual de apoyo a la decisión. No realiza operaciones y no es un consejo financiero.
- Las sesiones usan UTC + desfase manual (sin automatización de horario de verano).
- La longitud del dibujo histórico está controlada por Barras de arranque y Mantener últimas sesiones.
- “Ve la sesión. Marca el rango. Opera la ruptura con claridad.”
Aspectos destacados de los parámetros (rápido)
- Minutos ORB: duración de la ventana del rango de apertura
- Color / Ancho / Estilo de línea ORB: apariencia del Alto/Bajo ORB
- Usar filtro ATR + ATR k: control de estricticidad de ruptura
- Modo de señal: SoloCruces (limpio) o Estado (más visual)
- Permitir sesiones superpuestas: cajas multi-sesión cuando los horarios se superponen
- Mantener últimas sesiones: cuántas sesiones pasadas permanecen en el gráfico
- Limitación de actualización (ms): rendimiento vs capacidad de respuesta
Resumen
Resumen de IA
QX SessionBox ORB is an indicator for cTrader that visually overlays trading sessions and Opening Range Breakout (ORB) levels on price charts. It highlights the Asia, London, and New York sessions with customizable time ranges and colors, minimizing chart clutter. The indicator builds the Opening Range for a user-defined number of minutes and displays ORB High and Low lines as key intraday structure levels, with adjustable appearance settings.
A compact dashboard panel provides real-time session status, ORB readiness, bias, and Average True Range (ATR) information for quick context assessment. Optional features include an ORB range highlight box, closed-candle breakout confirmation signals, and an ATR filter to reduce false breakouts. An advanced mode supports overlapping sessions, allowing multiple session boxes to display when session times overlap, with configurable primary session control.
Designed for stability and efficiency, QX SessionBox ORB uses closed-candle logic to avoid intrabar flicker, throttled updates for lower CPU usage, and options to keep a set number of past sessions visible. Users set session UTC offsets manually and can customize parameters such as ORB minutes, signal modes, and update frequency. The tool serves as a visual decision-support aid for intraday breakout trading across various markets including Forex, indices, commodities, and cryptocurrencies.
Perfil del indicador
Valoraciones de clientes
5.0
Valoraciones: 2
5 | 100 % | |
4 | 0 % | |
3 | 0 % | |
2 | 0 % | |
1 | 0 % |
Conversación
Preguntas frecuentes
BTCUSD
Forex
Signal
Breakout
Indices
EURUSD
Commodities
GBPUSD
NZDUSD
RSI
Bollinger
Fibonacci
Scalping
Grid
Stocks
AI
XAUUSD
NAS100
ATR
USDJPY
VWAP
Los productos disponibles a través de cTrader Store, incluidos bots, indicadores y plugins para operar, son proporcionados por desarrolladores de terceros y están disponibles únicamente con fines informativos y de acceso técnico. cTrader Store no es un bróker, por lo que no proporciona asesoramiento de inversión, recomendaciones personales ni ninguna garantía de rentabilidad futura.


Precio
41.97M
Volumen operado
208.53K
Pips ganados
14
Ventas
362
Instalaciones gratis