
Mô tả
QX Heatmap Scanner là một bảng heatmap nhỏ gọn trên biểu đồ giúp bạn quét nhiều ký hiệu và khung thời gian trong vài giây. Nó tóm tắt Hướng, Sức mạnh và Biến động thành một điểm số rõ ràng cho mỗi ô để bạn có thể ưu tiên các điều kiện tốt nhất và tránh các thiết lập chất lượng thấp.
Những gì bạn thấy
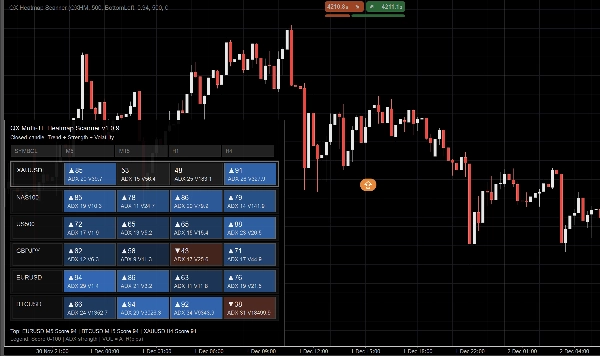
Mỗi ô (Ký hiệu × Khung thời gian) hiển thị:
- Điểm số (0–100) với dấu hiệu hướng (▲/▼ khi có xu hướng)
- ADX giá trị (bối cảnh sức mạnh)
- VOL giá trị (bối cảnh biến động)
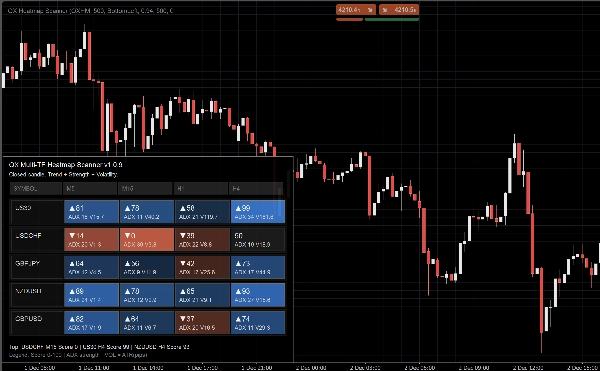
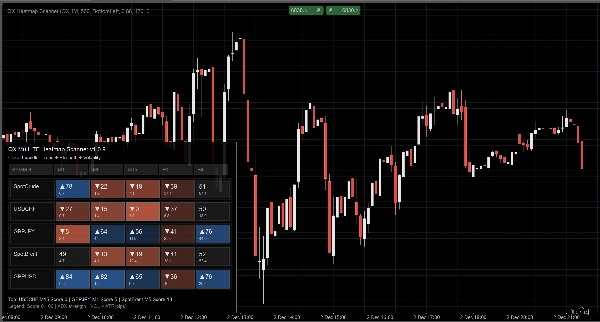
Cường độ màu phản ánh sự chắc chắn. Bố cục vẫn dễ đọc ngay cả với nhiều khung thời gian.
Chế độ hiển thị
- Tự động: thích ứng với chiều rộng ô có sẵn
- Đầy đủ: chi tiết tối đa
- Gọn nhẹ: tối ưu cho nhiều khung thời gian hơn trong khi vẫn giữ ADX và VOL hiển thị
- Tối giản: bố cục siêu gọn cho màn hình nhỏ
Tại sao nó hữu ích
- Bối cảnh từ trên xuống nhanh hơn trước khi vào lệnh
- So sánh nhanh giữa các thị trường mà không cần mở nhiều biểu đồ
- Quyết định rõ ràng hơn bằng cách làm nổi bật các điều kiện mạnh hơn
Hiệu suất và độ ổn định
- Thiết kế để cập nhật trên nến đã đóng để tín hiệu sạch hơn và giảm nhiễu
- Giới hạn cập nhật (ms) để kiểm soát sử dụng CPU
- Xử lý phòng ngừa cho ký hiệu thiếu hoặc dữ liệu không đủ
Tính năng chính
- Bảng heatmap đa ký hiệu, đa khung thời gian
- Điểm số 0–100 cho mỗi ô với chỉ dẫn hướng rõ ràng
- ADX và VOL hiển thị nhất quán
- Điều chỉnh góc bảng, chiều rộng, độ mờ và phông chữ
- Tùy chỉnh màu sắc (bull/bear/trung lập + phạm vi cường độ)
Các tham số chính
Ký hiệu (CSV), Khung thời gian (CSV), Mật độ hiển thị, Chiều rộng/Góc/Độ mờ bảng, Hiển thị VOL, Kích thước phông chữ, Giới hạn cập nhật.
Lưu ý: Công cụ này cung cấp bối cảnh thị trường. Nó không phải là hệ thống giao dịch tự động và không thay thế quản lý rủi ro.
Tóm tắt
The panel supports various display modes—Auto, Full, Compact, and Minimal—allowing customization for different screen sizes and detail preferences. Users can adjust panel position, width, opacity, fonts, and color schemes for bullish, bearish, and neutral conditions.
QX Heatmap Scanner updates on closed candles to reduce noise and includes an update throttle feature to manage CPU usage. It handles missing symbols or insufficient data defensively to maintain stability.
Key features include quick top-down market context, cross-market comparison without multiple charts, and highlighting of stronger trading conditions. It supports symbols such as BTCUSD, EURUSD, GBPUSD, and markets including Forex, Crypto, Stocks, Commodities, and Indices. Parameters like symbols, timeframes, display density, and update throttle are user-configurable.
This tool provides market context to assist decision-making but does not execute trades or replace risk management.
Đánh giá của khách hàng
5 | 33 % | |
4 | 67 % | |
3 | 0 % | |
2 | 0 % | |
1 | 0 % |


