
Mô tả
QX RiskShield là một công cụ tính rủi ro trên biểu đồ chuyển đổi khoảng cách dừng lỗ của bạn thành kích thước vị trí chính xác (Đơn vị và Lô), cùng với mức giá SL/TP dựa trên mục tiêu R:R của bạn. Nó được thiết kế để ra quyết định nhanh chóng với sự tối thiểu về sự lộn xộn trên biểu đồ.
Đây là một chỉ báo. Nó không đặt lệnh.
Những gì bạn thấy:
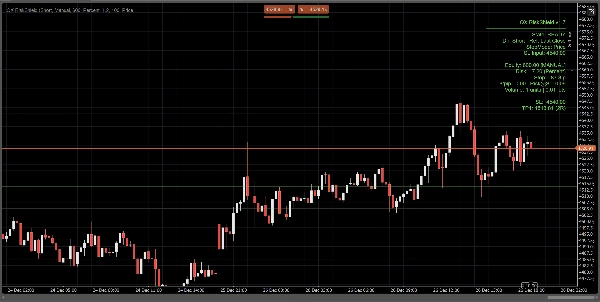
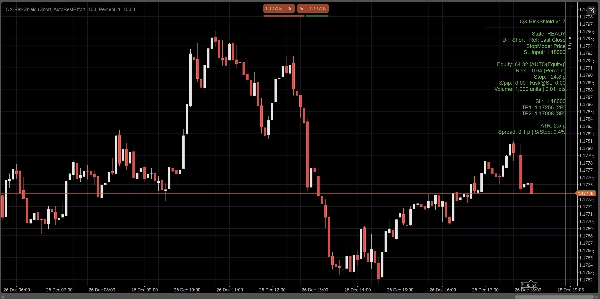
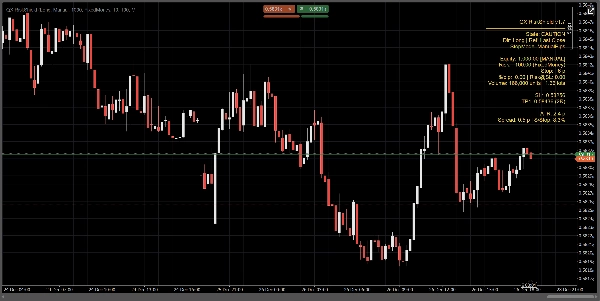
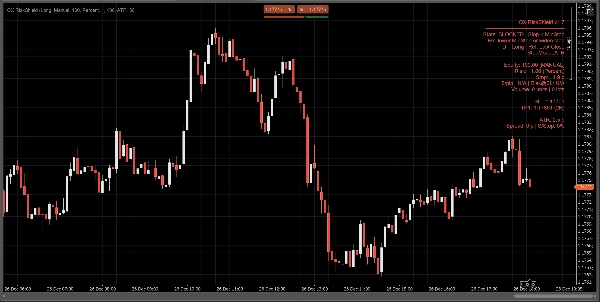
Một bảng điều khiển nhỏ gọn hiển thị, ngay lập tức:
- Trạng thái: SẴN SÀNG / CẨN THẬN / BỊ CHẶN
- Nguồn vốn chủ sở hữu: Thủ công hoặc Tự động (cố gắng tốt nhất, an toàn khi dự phòng)
- Số tiền rủi ro: % vốn chủ sở hữu hoặc rủi ro tiền cố định
- Khoảng cách dừng lỗ: tính bằng pip
- Kích thước vị trí: Đơn vị + Lô (chuẩn hóa theo giới hạn của nhà môi giới)
- $/pip và Rủi ro@SL (ước tính rủi ro tại điểm dừng)
- Mức giá SL / TP1 / TP2 (dựa trên mục tiêu RR của bạn)
- Tùy chọn đường Entry / SL / TP trên biểu đồ để tham khảo trực quan
Tất cả các phép tính dựa trên Đóng cửa cuối cùng (ổn định, không nhấp nháy trong thanh).
Chế độ dừng lỗ:
Chọn cách định nghĩa dừng lỗ của bạn:
1) Pips thủ công
Đặt khoảng cách dừng lỗ cố định tính bằng pip.
2) Dừng ATR
Khoảng cách dừng = ATR(pip) × hệ số ATR k.
Hữu ích cho việc điều chỉnh kích thước theo biến động trên các ký hiệu.
3) Dừng giá
Đặt giá SL chính xác (tốt nhất cho giao dịch theo quyết định cá nhân).
RiskShield chuyển đổi khoảng cách giá đó thành pip và điều chỉnh kích thước vị trí tương ứng.
Logic trạng thái (không gây nhầm lẫn):
RiskShield sử dụng các trạng thái rõ ràng để người dùng ngay lập tức hiểu điều gì đang xảy ra:
SẴN SÀNG
Các đầu vào hợp lệ. Kích thước vị trí có sẵn.
CẨN THẬN
Kích thước hợp lệ, nhưng RiskShield phát hiện dừng lỗ chặt so với ATR.
Đây là cảnh báo, không phải là chặn.
BỊ CHẶN
Kích thước bị vô hiệu hóa cố ý khi các quy tắc không an toàn hoặc không hợp lệ, chẳng hạn như:
- Dừng lỗ dưới ngưỡng dừng tối thiểu
- Giá SL ở phía sai của giá tham chiếu
- Spread quá cao so với dừng lỗ (Tỷ lệ Spread/Dừng %)
- Khối lượng sẽ dưới mức tối thiểu của nhà môi giới
- Dữ liệu pip/lô của ký hiệu không có sẵn
Một gợi ý “Sửa” ngắn có thể được hiển thị (tùy chọn) để sửa các đầu vào nhanh chóng.
Cách các nhà giao dịch sử dụng QX RiskShield (quy trình đơn giản)
- Gắn QX RiskShield vào biểu đồ của bạn.
- Chọn Hướng giao dịch (Mua hoặc Bán).
- Chọn Loại rủi ro của bạn:
-
- Phần trăm vốn chủ sở hữu, hoặc
- Rủi ro tiền cố định cho mỗi giao dịch
- Chọn Chế độ dừng lỗ:
-
- Pips thủ công, ATR, hoặc Giá SL
- Đọc kết quả:
-
- Sử dụng Đơn vị/Lô cho kích thước lệnh của bạn
- Sử dụng mức SL/TP làm giá tham chiếu của bạn
- Nếu bảng điều khiển hiển thị CẨN THẬN, hãy cân nhắc mở rộng khoảng cách dừng hoặc sử dụng chế độ ATR.
- Nếu bảng điều khiển hiển thị BỊ CHẶN, điều chỉnh các đầu vào cho đến khi SẴN SÀNG.
Tùy chọn giao diện người dùng (thiết kế cho biểu đồ sạch):
- Chế độ bảng điều khiển: Đơn giản hoặc Chuyên nghiệp
- Mật độ bảng điều khiển: Bình thường hoặc Gọn nhẹ (cho văn bản tối thiểu)
- Hiển thị gợi ý sửa: Bật/Tắt
- Hiển thị các đường: Bật/Tắt
- Hiển thị đường Entry: Bật/Tắt
- Điều khiển căn chỉnh bảng điều khiển và giới hạn cập nhật để tăng hiệu suất
Hiệu suất và độ ổn định:
- Sử dụng Đóng cửa cuối cùng cho các phép tính. Không có hành vi vẽ lại.
- Giới hạn cập nhật để giảm sử dụng CPU trên các không gian làm việc bận rộn.
- Xử lý phòng thủ cho dữ liệu ký hiệu, giới hạn nhà môi giới và các trường tài khoản thiếu.
Lưu ý quan trọng:
- QX RiskShield là một công cụ hỗ trợ quyết định, không phải lời khuyên tài chính.
- Kết quả phụ thuộc vào các thông số ký hiệu của nhà môi giới của bạn (giá trị pip, kích thước lô, khối lượng tối thiểu, v.v.).
- Vốn tự động là cố gắng tốt nhất. Nếu nền tảng hạn chế truy cập, RiskShield sẽ an toàn chuyển sang vốn thủ công.
Phù hợp cho:
- Các nhà giao dịch FX chính và chỉ số
- Quy tắc rủi ro kiểu công ty đầu tư
- Các nhà giao dịch lướt sóng và giao dịch trong ngày muốn kích thước nhanh với kiểm tra an toàn nghiêm ngặt
- Các nhà giao dịch thích SL dựa trên giá nhưng vẫn muốn kích thước tự động
Giao dịch có kiểm soát. Kích thước chính xác.
Tóm tắt
Đánh giá của khách hàng
5 | 0 % | |
4 | 100 % | |
3 | 0 % | |
2 | 0 % | |
1 | 0 % |


