
Описание
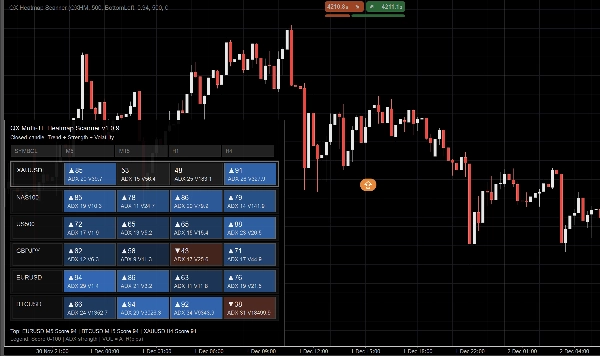
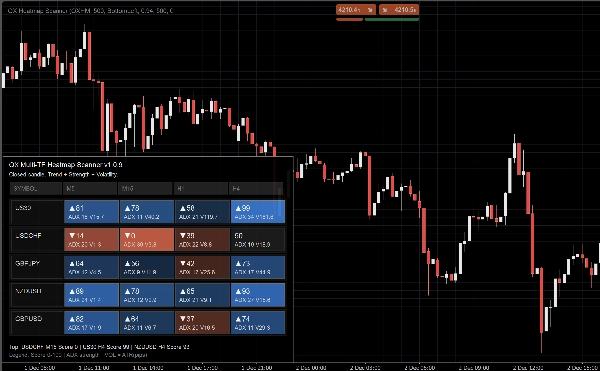
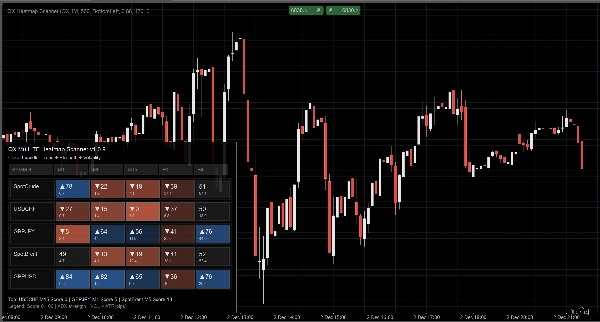
QX Heatmap Scanner — это компактная панель тепловой карты на графике, которая помогает сканировать несколько символов и таймфреймов за секунды. Она суммирует рыночное Направление, Силу и Волатильность в понятный балл для каждой ячейки, чтобы вы могли приоритизировать лучшие условия и избегать низкокачественных настроек.
Что вы видите
Каждая ячейка (Символ × Таймфрейм) отображает:
- Баллы (0–100) с направленным маркером (▲/▼ при наличии смещения)
- ADX значение (контекст силы)
- VOL значение (контекст волатильности)
Интенсивность цвета отражает уверенность. Макет остается читаемым даже при большом количестве таймфреймов.
Режимы отображения
- Авто: адаптируется к доступной ширине ячейки
- Полный: максимальная детализация
- Компактный: оптимизирован для большего количества таймфреймов при сохранении видимости ADX и VOL
- Минимальный: ультра-компактный макет для маленьких экранов
Почему это помогает
- Быстрый контекст сверху вниз перед входами
- Быстрое сравнение между рынками без открытия множества графиков
- Чище принятие решений благодаря выделению более сильных условий
Производительность и стабильность
- Разработано для обновления на закрытых свечах для более чистых сигналов и меньшего шума
- Ограничение обновления (мс) для контроля использования ЦП
- Защитная обработка отсутствующих символов или недостаточных данных
Основные функции
- Панель тепловой карты с несколькими символами и таймфреймами
- Баллы 0–100 для каждой ячейки с четкими указателями направления
- Постоянное отображение ADX и VOL
- Настраиваемый угол панели, ширина, прозрачность и шрифты
- Настройка цветов (бычий/медвежий/нейтральный + диапазон интенсивности)
Ключевые параметры
Символы (CSV), Таймфреймы (CSV), Плотность отображения, Ширина/Угол/Прозрачность панели, Показать VOL, Размеры шрифтов, Ограничение обновления.
Примечание: Этот инструмент предоставляет рыночный контекст. Он не является системой автотрейдинга и не заменяет управление рисками.
Сводка
The panel supports various display modes—Auto, Full, Compact, and Minimal—allowing customization for different screen sizes and detail preferences. Users can adjust panel position, width, opacity, fonts, and color schemes for bullish, bearish, and neutral conditions.
QX Heatmap Scanner updates on closed candles to reduce noise and includes an update throttle feature to manage CPU usage. It handles missing symbols or insufficient data defensively to maintain stability.
Key features include quick top-down market context, cross-market comparison without multiple charts, and highlighting of stronger trading conditions. It supports symbols such as BTCUSD, EURUSD, GBPUSD, and markets including Forex, Crypto, Stocks, Commodities, and Indices. Parameters like symbols, timeframes, display density, and update throttle are user-configurable.
This tool provides market context to assist decision-making but does not execute trades or replace risk management.
Отзывы покупателей
5 | 33 % | |
4 | 67 % | |
3 | 0 % | |
2 | 0 % | |
1 | 0 % |


