
supertrend
Gösterge
5 satın almalar
Sürüm 1.0, May 2025
Windows, Mac
4.3
Değerlendirmeler: 3
Açıklama
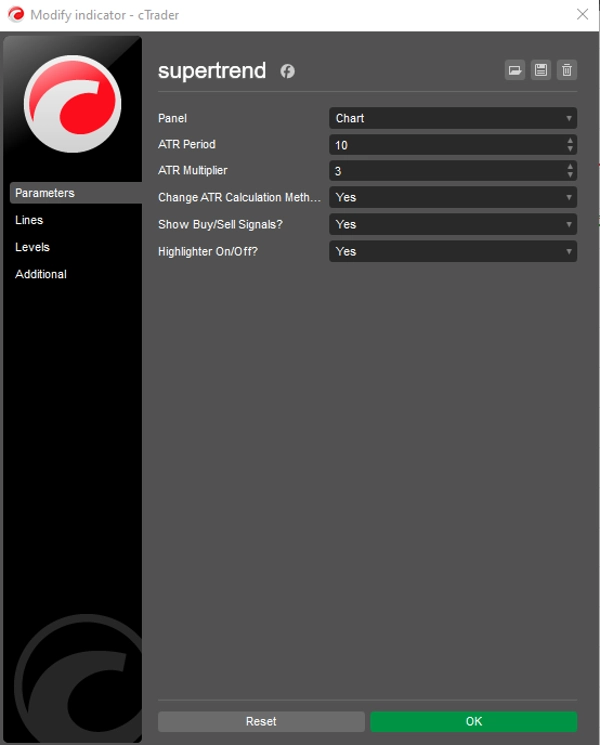
cTrader için Supertrend Göstergesi
Supertrend Göstergesi, tüccarların piyasa trendlerini ve potansiyel giriş/çıkış noktalarını kolayca belirlemelerine yardımcı olmak için tasarlanmış güçlü ve çok yönlü bir trend takip aracıdır. cTrader platformu için geliştirilmiş olan bu gösterge, Ortalama Gerçek Aralık (ATR) kullanarak dinamik destek ve direnç seviyelerini hesaplar ve yükseliş ve düşüş trendleri için net görsel sinyaller sağlar. Basitliği ve etkinliği, onu skalpçılardan uzun vadeli yatırımcılara kadar her deneyim seviyesindeki tüccarlar arasında popüler kılar.
Özet
YZ özeti
The Supertrend Indicator for cTrader is a trend-following tool that helps traders identify market trends and potential entry and exit points. It uses the Average True Range (ATR) to calculate dynamic support and resistance levels, providing clear visual signals for bullish and bearish trends. Designed for use on the cTrader platform, this indicator supports markets including Forex and indices. Its straightforward design makes it suitable for traders of various styles and experience levels, from scalpers to long-term investors. The indicator outputs trend strength signals based on bar data, aiding in market analysis without opening positions automatically.
Gösterge profili
Gösterge kategorisi
Trend
Çıktı türü
Sinyaller
Veri gereklilikleri
Yalnızca çubuklar
Desteklenen sinyaller
Trend gücü
Müşteri değerlendirmeleri
4.3
Değerlendirmeler: 3
5 | 67 % | |
4 | 0 % | |
3 | 33 % | |
2 | 0 % | |
1 | 0 % |
Müşteri değerlendirmeleri
June 3, 2025
Practical entry check for traders who prefer directional setups. It gives value around trend filtering, but sideways markets can weaken the signal. The signal feels safer when trend strength is clear and DD stays under 3 percent. It is a filter for bias, not a reason to ignore risk.
June 2, 2025
June 2, 2025
Clean confirmation helper for trend filtering. it helps keep attention on the broader move, especially when used for filtering out random countertrend ideas. I would judge the trend read across 3 sessions, with at least 2 higher timeframe candles agreeing. It is a filter for bias, not a reason to ignore risk.
Tartışma
SSS
Prop
Forex
Signal
Indices
Supertrend
ATR
cTrader Store üzerinden erişilebilen işlem botları, göstergeler ve eklentiler gibi ürünler, üçüncü taraf sağlayıcılar tarafından sağlanır ve yalnızca bilgilendirme ve teknik erişim amaçlarıyla sunulur. cTrader Store bir broker değildir ve yatırım tavsiyesi, kişisel öneriler vermez veya gelecekteki performansı garanti etmez.


Fiyat
Başlangıç 30/05/2025
40
Satışlar