
Açıklama
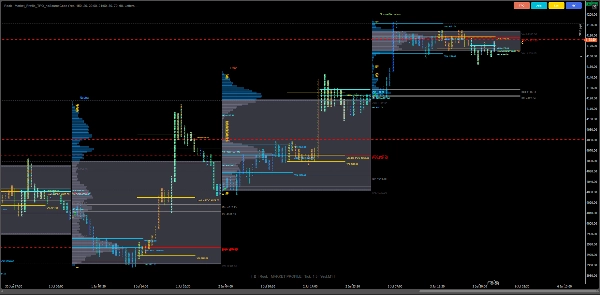
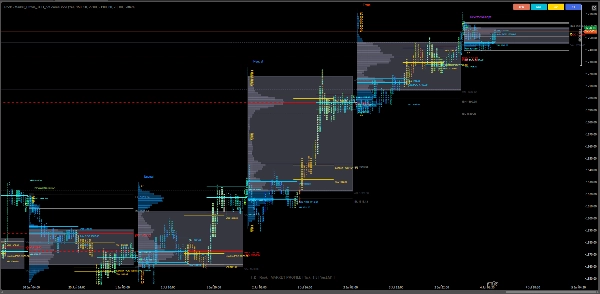
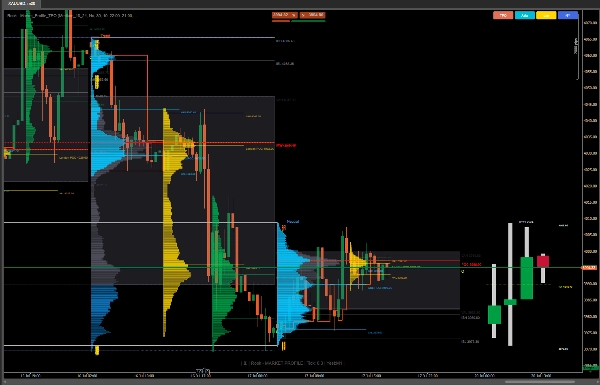
Market Profile TPO (Time Price Opportunity) brings institutional-grade market structure visualization to cTrader — enabling traders to see how price, time, and volume interact across sessions in one intelligent view.
Designed for professional day traders, auction market analysts, and order flow enthusiasts, this indicator delivers a true representation of market activity using TPO letters, boxes, and histograms. It helps you identify value areas, POC zones, initial balance ranges, and naked levels with pinpoint accuracy.
⚙️ Core Features
✅ (TPO) Visualization
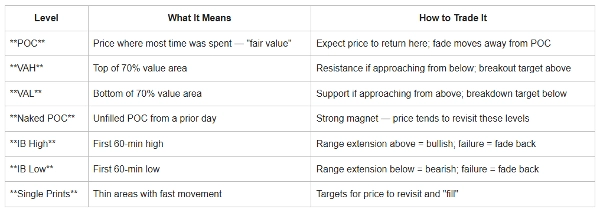
✅ POC & Value Area Zones
✅ Developing POC
✅ Initial Balance (IB) Detection
✅ Session & Time zone Intelligence
✅ TPO Display Modes( Letters / Histogram )
✅ Open/Close Price Markers (O/X)
✅ Single Prints & Naked POC/VA Levels
✅ Day & Previous Day OHLC Overlay
✅ Day & Previous Day OHLC Overlay
✅ HTF Bar Projection (AMD)
Major Improvements
✔ Faster loading
✔ Better memory management
✔ Accurate Value Area calculation
✔ Correct session profile positioning
✔ Better toggle performance
✔ Cross-platform compatibility
✔ UTC-based sessions (no automatic DST)
✔ Improved naked POC handling
✔ Improved profile rendering
🧭 Trading Use Cases
🔹 Intraday Auction Analysis — Identify where value is forming, migrating, or breaking.
🔹 POC & Value Reversion Trades — Target equilibrium retests or fading extremes.
🔹 Initial Balance Breakouts — Spot when the session expands beyond its first-hour range.
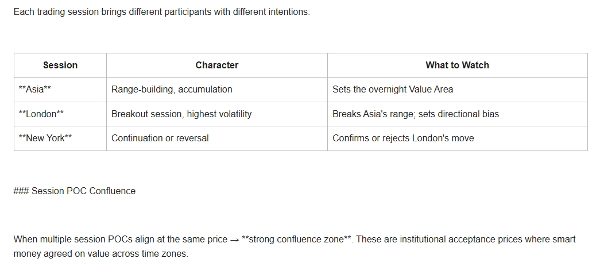
🔹 Session Rotation Study — Compare profiles across Asia, London, and New York sessions with timezone alignment.
🔹 Institutional Context Building — Combine with volume or delta tools to validate smart money footprints.
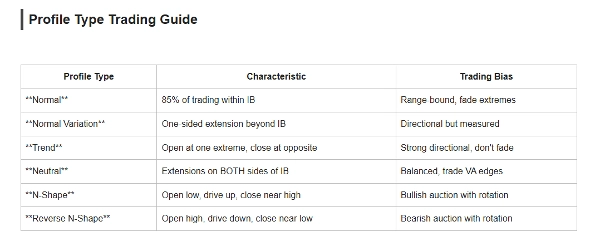
Profile Types
Type Market Condition
Normal Balanced Market
Normal Variation Moderate Trend
Trend Strong Directional Day
Neutral Two-sided Auction
N-Shape Bullish Auction
Reverse N-Shape Bearish Auction
Ideal For
- Auction Market Theory (AMT)
- Market Profile Traders
- Intraday Traders
- Swing Traders
- Futures Traders
- Forex Traders
- Professional Order Flow Analysis
Bring institutional clarity to your charts.
The Market Profile TPO indicator turns raw price data into a story of value, imbalance, and opportunity
Disclaimer: This indicator is provided for educational and informational purposes only and does not constitute financial, investment, or trading advice. Market Profile is an analytical tool and does not guarantee profits or future results.
Trading financial markets involves substantial risk, and past performance does not guarantee future outcomes. Users are solely responsible for their trading decisions, risk management, and any resulting profits or losses.
Always perform your own analysis and consult a qualified financial professional before making investment or trading decisions.
Özet
Key features include multiple TPO display modes (letters and histogram), session and timezone intelligence with UTC-based sessions, open/close price markers (O/X), single prints, naked POC/VA levels, and overlays of day and previous day OHLC data. The indicator supports analysis of various market conditions through profile types like Normal (balanced market), Normal Variation (moderate trend), Trend (strong directional day), Neutral (two-sided auction), N-Shape (bullish auction), and Reverse N-Shape (bearish auction).
It is suitable for professional day traders, auction market analysts, order flow enthusiasts, and traders across Forex, indices, and commodities markets. Typical use cases include intraday auction analysis, POC and value reversion trades, initial balance breakouts, session rotation studies, and institutional context building when combined with volume or delta tools.
This indicator provides a detailed, structured view of market dynamics to support informed trading decisions based on Auction Market Theory and Market Profile principles.
Müşteri değerlendirmeleri
5 | 0 % | |
4 | 100 % | |
3 | 0 % | |
2 | 0 % | |
1 | 0 % |


