
Smart Money Map - JR
Chỉ báo
1 lượt mua
Phiên bản 2.0, May 2026
Windows, Mac
4.0
Đánh giá: 2
Mô tả
Chỉ báo phủ nâng cao để làm nổi bật bối cảnh thực thi chính và giúp căn chỉnh cấu trúc, vị trí và rủi ro trong một quy trình làm việc hợp lý.
➤ Tính năng chính
- Gán nhãn sự kiện cấu trúc với độ nhạy và chế độ xác nhận có thể cấu hình
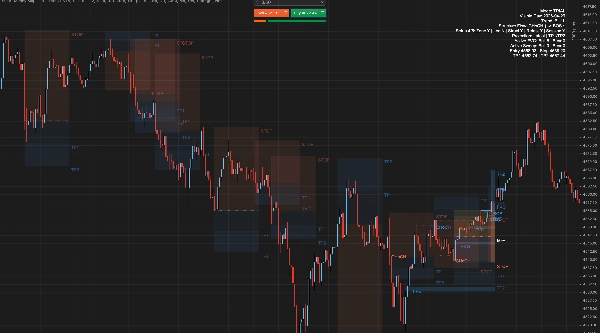
- Bản đồ khoảng trống giá công bằng hoạt động với kích thước và lọc phiên có thể cấu hình
- Phát hiện quét thanh khoản cho bối cảnh sớm (chỉ điểm, chế độ tối thiểu)
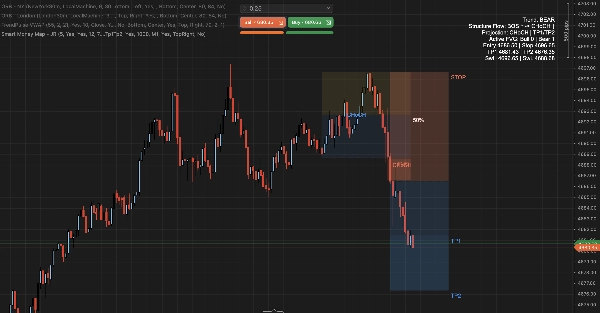
- Phạm vi giao dịch cao cấp/chiết khấu với cân bằng 50%
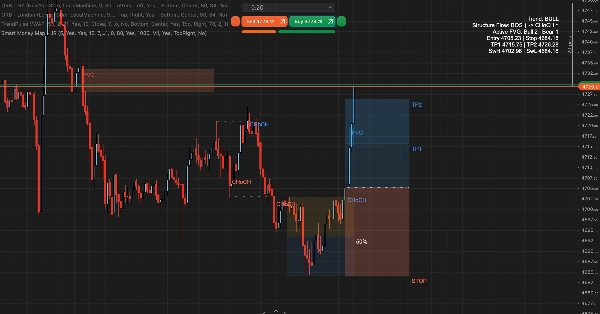
- Hộp dự báo nhập cảnh/dừng lỗ/mục tiêu động
- Hiển thị mục tiêu linh hoạt: mục tiêu đơn, chia TP1/TP2 hoặc mục tiêu dựa trên cấu trúc
- Tùy chọn hiển thị nhãn dự báo và giới hạn dừng tối đa để kiểm soát nội ngày chặt chẽ hơn
- Kênh đầu ra sẵn sàng tự động hóa cho quy trình làm việc cBot
- Vị trí bảng điều khiển linh hoạt cho biểu đồ đa chỉ báo
- Cài đặt mật độ với điều chỉnh thời gian tự động tùy chọn
➤ Cách hoạt động
- Xác nhận các dao động cấu trúc và theo dõi trạng thái chuyển hướng và tiếp tục.
- Phát hiện quét thanh khoản vượt qua các mức dao động được bảo vệ.
- Lập bản đồ các vùng mất cân bằng hoạt động và cập nhật chúng khi giá tương tác với cấu trúc.
- Định vị vị trí thị trường hiện tại với bối cảnh cao cấp/chiết khấu.
- Dự báo bản đồ rủi ro từ trạng thái cấu trúc hiện tại.
- Xuất bản các sự kiện đầu ra xác định cho tự động hóa.
➤ Phù hợp nhất cho
- Lập biểu đồ và lập kế hoạch thực thi SMC nội ngày
- Các nhà giao dịch muốn có cấu trúc trực quan và bối cảnh POI mà không bị rối mắt
- Cài đặt đa chỉ báo cần vị trí bảng điều khiển có thể cấu hình
➤ Cách sử dụng
- Đọc cấu trúc trước bằng cách sử dụng chỉ báo xu hướng trên bảng điều khiển.
- Sử dụng bối cảnh vị trí để xác định các vùng cao cấp và chiết khấu.
- Sử dụng các vùng mất cân bằng hoạt động và bối cảnh quét tùy chọn để tinh chỉnh thời gian.
- Sử dụng bản đồ dự báo làm tham chiếu lập kế hoạch giao dịch.
➤ Các điều khiển bao gồm
- Độ nhạy cấu trúc và chế độ xác nhận
- Kích thước mất cân bằng, lọc phiên và hành vi hiển thị giảm thiểu
- Phạm vi giao dịch và tùy chọn hiển thị dự báo
- Điều khiển dự báo bao gồm chế độ mục tiêu, chế độ neo, hiển thị nhãn và giới hạn dừng tùy chọn
- Chế độ mật độ: Tùy chỉnh, M1, M5, M15, H1, H4, D1
- Điều chỉnh mật độ tự động tùy chọn dựa trên khung thời gian biểu đồ
- Tùy chỉnh màu sắc để dễ đọc biểu đồ
Tóm tắt
Tóm tắt AI
Smart Money Map - JR is an advanced overlay indicator designed for intraday trading to visually highlight key market execution contexts by integrating structure, location, and risk into a streamlined workflow. It identifies and labels structural events with configurable sensitivity and confirmation modes, detects liquidity sweeps beyond swing levels, and maps active fair value gaps with adjustable sizing and session filters. The indicator frames market price zones into premium and discount ranges centered around a 50% equilibrium level.
It features dynamic projection boxes for entry, stop, and target levels, supporting flexible target visualization options including single targets, split take-profits, or structure-derived targets. Users can control projection label visibility and apply maximum stop caps for tighter intraday risk management. The tool supports automation through deterministic event outputs compatible with cBot workflows and allows customizable dashboard placement for multi-indicator chart setups. Density presets with optional automatic timeframe adjustment enhance adaptability across different chart resolutions.
The indicator operates by confirming structural swings, tracking directional shifts, detecting liquidity sweeps, updating imbalance zones as price interacts with structure, and projecting a risk map based on current market conditions. It is suited for traders seeking clear visual structure and points of interest without chart clutter, particularly those focused on Smart Money Concepts (SMC) and market structure analysis.
Hồ sơ chỉ báo
Danh mục chỉ báo
Cấu trúc thị trường (SMC)
Loại đầu ra
Hình ảnh trực quan
Yêu cầu dữ liệu
Chỉ dữ liệu nến
Tín hiệu được hỗ trợ
Sức mạnh xu hướng
Phá ngưỡng
Chạm ngưỡng
Đánh giá của khách hàng
4.0
Đánh giá: 2
5 | 0 % | |
4 | 100 % | |
3 | 0 % | |
2 | 0 % | |
1 | 0 % |
Thảo luận
Câu hỏi thường gặp
Premium/Discount
MSS
BOS
CHOCH
Market Structure
Các sản phẩm có sẵn trên cTrader Store, bao gồm bot giao dịch, chỉ báo và plugin, được cung cấp bởi các nhà phát triển bên thứ ba và chỉ nhằm mục đích cung cấp thông tin và tiếp cận kỹ thuật. cTrader Store không phải là nhà môi giới và không cung cấp lời khuyên đầu tư, khuyến nghị cá nhân hay bất kỳ đảm bảo nào về hiệu suất trong tương lai.


Giá
Kể từ 11/02/2026
14
Lượt bán
77
Cài đặt miễn phí