present
가입하고 첫 구매 시 $50 할인을 받으세요
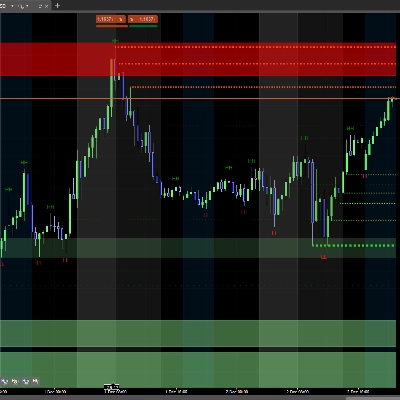
Trading product for Supply n Demand 지표 Volume Supply & Demand, image 1
Supply n Demand
지표
242 다운로드
버전 1.0, Jul 2026
Windows, Mac
5.0
리뷰: 2
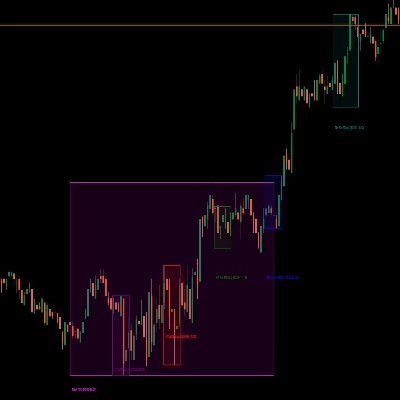
Trading product for Supply n Demand 지표 Volume Supply & Demand, image 2
Trading product for Supply n Demand 지표 Volume Supply & Demand, image 3
가입일 11/02/2026
18
판매
403
무료 설치

설명

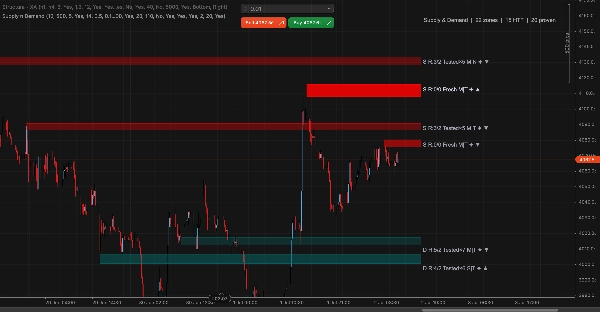
스윙 피벗에서 공급 및 수요 영역 감지, 다중 타임프레임 합류 및 거래량 필터링 포함. 영역은 20봉 앞으로 투사되며 모든 재테스트 및 돌파를 추적합니다 - 영역 불투명도는 시간이 지남에 따라 희미해지고, MTF 합류 영역은 굵은 테두리가 생기며, 역할 전환은 깨진 영역을 반대편으로 전환합니다.

각 영역에는 모든 품질 신호가 포함된 컴팩트 라벨이 있습니다: S/D 유형, 재테스트/돌파 횟수, 신선도 (Fresh/Tested×N), 폭발성 (강함/보통/약함), 베이스 조임 정도 (조임/보통/넓음), HTF 합류 (✦), 형성 시 거래량 (▲/▼). Fresh + ✦ + ▲ 영역은 가장 높은 품질로, 손대지 않은 상태이며 H4 구조로 확인되고, 높은 거래량에서 형성됩니다.


➤ 기능

• 구성 가능한 기간을 가진 스윙 피벗 감지 (기본값 M15에서 20)
• H4 HTF 하드 게이트 — H4 구조와 겹치는 영역만 생성 (선택 사항)
• 다중 터치 보호 — 돌파가 계산되기 전에 영역은 N번의 재테스트를 견뎌야 함
• 거래량 필터 — 평균 이상의 틱 거래량에서 형성된 영역에 ▲ 태그 부여
• 영역 전환 / 역할 전환 — 깨진 공급 영역은 수요 영역으로 전환 (및 그 반대)
• 시각적 페이드 — 터치가 많아질수록 불투명도 감소; 전역 페이드%가 투명도 조절
• 추세선 경계 테두리 — 영역 범위에 맞게 클리핑, HTF 영역에 대해 더 강함
• 컴팩트 대시보드 — 우측 상단에 영역 수, HTF 수, 검증된 영역 수 표시
• 검증된 영역 보존 — 3회 이상 터치된 영역은 만료되지 않음


➤ 매개변수 그룹

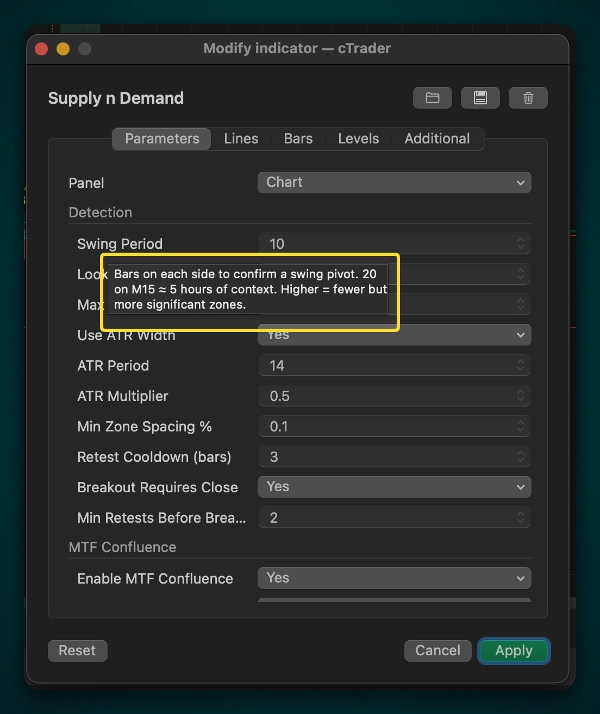
감지 — 스윙 기간, ATR 배수/크기, 돌파 규칙, 재테스트 쿨다운
MTF 합류 — H4 참조, HTF 하드 게이트 토글, HTF 스윙/되돌아보기
거래량 합류 — 거래량 MA, 임계값 %, 저거래량 억제
스타일 — 색상, 테두리 두께, 라벨 가시성
시각적 — 전역 페이드%, 대시보드 토글


➤ 거래 워크플로우

1. 고품질 영역 식별: Fresh, ✦, ▲, 조임 베이스
2. 가격이 영역에 도달할 때까지 대기 — 터치만으로 진입하지 마세요
3. 캔들 확인 대기 (수요에서 엔골핑, 핀바, 해머; 공급에서 슈팅 스타, 엔골핑)
4. 손절매는 영역 경계 + 버퍼 너머에; 이익 실현은 다음 반대 영역에서
5. 전환의 경우: 돌파 후 재테스트 대기, 그 다음 확인 캔들


➤ 권장 설정

• 스캘핑 (M1-M5): 스윙=8, ATR=1.0, HTF=H1, RequireHTF=false
• 인트라데이 (M15-M30): 스윙=20, ATR=1.5, HTF=H4, RequireHTF=true (기본값)
• 스윙 (H1-D1): 스윙=20, ATR=2.0, HTF=D1/W1, RequireHTF=true


➤ 라벨 읽기

각 영역은 오른쪽 가장자리에 압축된 품질 정보가 있는 라벨이 있습니다. 예: S R:3/2 Tested×5 M|N ✦ ▼

분석

  • S / D - 공급(저항) 또는 수요(지지)
  • R:3/2 - 재테스트:3 / 돌파:2 — 영역이 3번 유지되고 2번 깨짐
  • Tested×5 - 총 터치 수 (재테스트 + 돌파 = 5) — 신선도 지표
  • M|N - 폭발성|베이스: M=보통, N=보통 베이스 너비
  • ✦ - HTF 합류 확인 — 영역이 동일 유형의 H4 영역과 겹침
  • ▼ / ▲ - 형성 시 거래량: ▲=평균 이상 (강함), ▼=평균 이하 (약함)

한눈에 영역 읽는 법

  • Fresh + ✦ + ▲ — 최고 품질: 손대지 않은, 상위 타임프레임으로 확인된, 높은 거래량에서 형성된 영역
  • Tested×5-7 — 영역이 여러 번 작동되었으며, 터치할수록 유지 확률이 감소함
  • 더 투명한(희미한) 영역일수록 — 형성 거래량이 낮거나 터치 횟수가 많음을 의미합니다. 시각적 알파는 즉시 "마모된" 영역을 보여줍니다


이 지표는 분석용입니다. 거래를 실행하지 않습니다. 실거래 전에 반드시 데모 계좌에서 테스트하세요.

요약

AI 요약
Supply n Demand is a technical indicator designed to detect supply and demand zones based on swing pivots, incorporating multi-timeframe (H4) confluence and volume filtering. It projects zones 20 bars forward, tracking each retest and breakout, with zone opacity fading as zones age. Zones confirmed by higher timeframe structure have solid borders, and broken zones flip roles from supply to demand or vice versa.

Each zone features a compact label displaying key quality signals: zone type (Supply or Demand), retest and breakout counts, freshness, explosiveness, base tightness, higher timeframe confluence, and volume at formation. Zones formed on above-average tick volume and confirmed by H4 structure are marked as highest quality.

Key features include configurable swing pivot detection, optional H4 hard gate filtering, multi-touch protection requiring zones to survive multiple retests before breakout recognition, volume-based filtering, visual fading of zones with age or touches, and preservation of proven zones with three or more touches. A compact dashboard shows zone counts and quality metrics.

Parameters cover detection settings, multi-timeframe and volume confluence, visual style, and dashboard options. Recommended settings vary by trading style, from scalping to swing trading. The indicator provides visual support and resistance levels with detailed quality metrics for analysis but does not execute trades.
지표 프로필
지표 카테고리
지지 및 저항
출력 유형
시각화
데이터 요구 사항
막대만
거래량
지원되는 신호
레벨 터치
레벨 돌파

상담

고객 리뷰

5.0
리뷰: 2
5
100 %
4
0 %
3
0 %
2
0 %
1
0 %
고객 리뷰
September 21, 2026
Supply n Demand maps clear supply/demand zones with useful MTF and volume context. EURUSD and XAUUSD rendered cleanly on M1/H1, and the dashboard tracked zone, HTF and proven counts well.
July 23, 2026
Pack with all the info I need - retests, breakouts, volume, HTF- all in one. Great work!

자주 묻는 질문(FAQ)

Volume
Supply & Demand
트레이딩 봇, 지표, 플러그인 등 cTrader Store에서 제공되는 상품은 제3자 개발자에 의해 제공되며, 이는 단순히 정보 및 기술적 접근을 목적으로 제공된 것입니다. cTrader Store는 중개인이 아니며, 투자 조언, 개인별 추천 또는 향후 성과에 대한 어떠한 보장도 제공하지 않습니다.

이 작성자의 상품 더 보기

지표
ATR
Key Levels
+1
Builds active 4H range as a zone, watches for a sweep beyond its High or Low, and signals when price closes back inside.
데스크톱 플러그인
Prop
Forex
+4
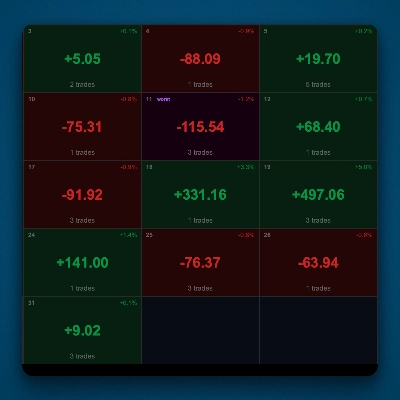
Visual monthly trading journal that displays your performance day-by-day in a calendar view.
지표
ATR
VWAP
+4
Structure-aware indicator that re-anchors VWAP to confirmed swing pivots.
지표
BOS
MSS
+3
Advanced indicator to highlight key execution context and help aligning structure, location, and risk.
지표
EMA
VWAP
+2
ORB Range Indicator maps the opening range and gives a practical session-breakout workflow with clear labels.

좋아하실 만한 다른 항목

지표
Volume
Key Levels
+1
Session volume profiles from tick volume: POC, value area high and low, and naked POCs extended until touched.
지표
Volume
Key Levels
View tick activity across a selected chart range with Point of Control, Value Area High and Value Area Low.
지표
Prop
Forex
+2
⚔️ JPY Samurai Breakout Pro — Professional Breakout Indicator for cTrader ⚔️
지표
Forex
BTCUSD
+6
The Market Sessions indicator is a popular tool for visually representing global trading sessions on a price chart.
지표
Forex
BTCUSD
+10
6-stage IIR filter trend indicator with colored line segments, reversal signals, alerts, and entry arrows.
지표
Forex
Crypto
+5
ICT Order Block Advanced
지표
SMC
Prop
+8
KILLZONES AND MACRO SESSIONS
지표
Scalping
Adaptive KAMA: fast in trend, slow in noise — with color-coded market state visualization.
지표
ATR
RSI
+5
Dual confirmation RSI + EMA crossover signals with visual alerts and dynamic ATR offsets.
지표
Forex
EURUSD
+5
Smart Money Breakout Channels – Auto-detect breakout zones with price, volume & volatility insights on cTrader.
지표
ATR
Key Levels
+1
Explore 88 harmonic price-pattern variants with interactive chart controls and geometric reference levels.
"Order Block" 로고
최고 평점
4.8
(5)
$19
지표
ATR
RSI
+7
Identify bullish and bearish Order Blocks to spot key support/resistance levels and potential trend reversals! 📈🔄
지표
RSI
Forex
+6
What Constance Brown did with the RSI was to input a momentum calculation within the RSI itself. This the Composite RSI.
지표
Forex
BTCUSD
+9
synchronize scroll position and zoom levels across multiple charts. Perfect for multi-timeframe analysis
지표
Imbalance
Key Levels
+4
This indicator combines Multi-Timeframe Liquidity tracking, a dynamic Fair Value Gap (FVG) and a 50% Daily Range
지표
ATR
RSI
+6
🔮Channel Price Predictor: Anticipates future price zones with trend channels based on volatility and projections." 📈
지표
Volume
Support & Resistance
Compare up to 27 symbols across eight timeframes with seven analysis engines and an interactive cTrader dashboard.
지표
Doji
Wedge
+5
Angora Pattern Recognition is a cTrader indicator that finds, draws and tracks classic chart patterns automatically.

가격

가입일 11/02/2026
18
판매
403
무료 설치