
Deskripsi
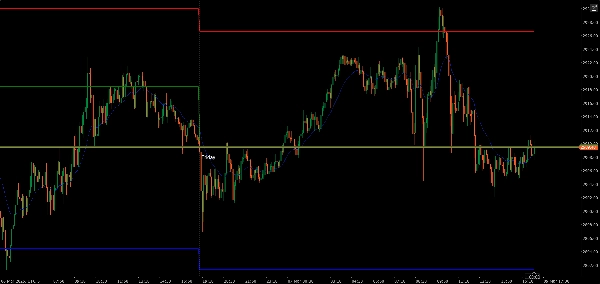
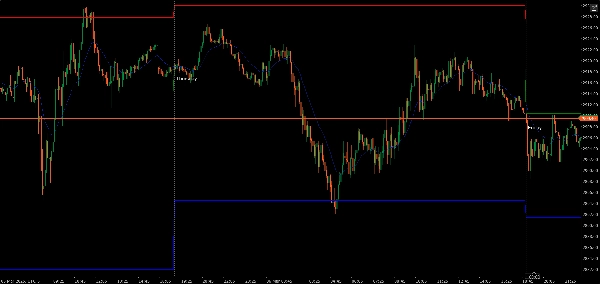
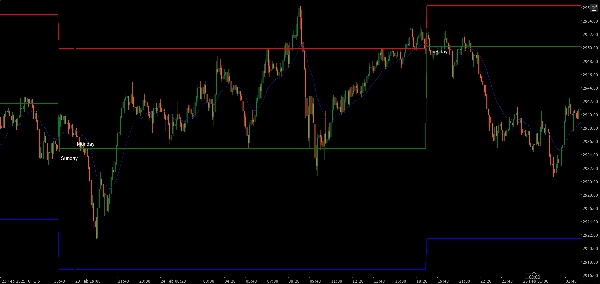
indikator tinggi rendah dan penutupan hari sebelumnya.
garis biru menunjukkan rendah hari sebelumnya.
garis merah menunjukkan tinggi hari sebelumnya.
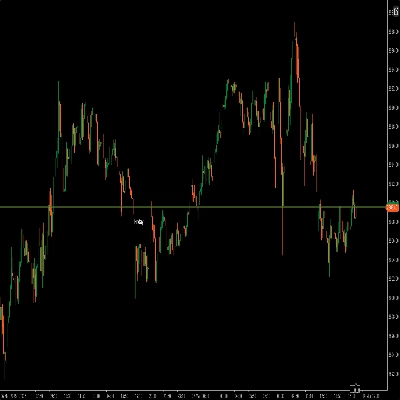
garis hijau menunjukkan penutupan hari sebelumnya.
Ringkasan
Ringkasan AI
The trPDHLC indicator displays the previous day's high, low, and closing prices on a trading chart. It uses color-coded lines for clear visualization: a red line marks the previous day's high, a blue line indicates the previous day's low, and a green line shows the previous day's closing price. This tool helps traders quickly reference key price levels from the prior trading day, aiding in technical analysis and decision-making. The indicator is tagged for use with indices markets.
Profil indikator
Ulasan pelanggan
0.0
Ulasan: 0
Ulasan pelanggan
Belum ada ulasan untuk produk ini. Sudah mencobanya? Jadilah pemberi ulasan pertama!
Diskusi
Pertanyaan umum
Indices
Produk-produk yang tersedia melalui cTrader Store, termasuk bot trading, indikator, dan plugin, disediakan oleh pengembang pihak ketiga serta hanya ditujukan untuk akses teknis dan informasi. cTrader Store bukan broker dan tidak menyediakan saran investasi, rekomendasi pribadi, atau jaminan apa pun tentang kinerja di masa mendatang.
Produk lain dari penulis ini


![Logo "High-Low Divergence [Iridio Capital]"](https://cdn.ctrader.com/image/webp/443c4661-7abb-40f1-842f-4b6ec560649b_40914)


Harga
Sejak 08/03/2025
1
Penjualan