
MTF Candle Countdown
Indikator
3 pembelian
Versi 1.0, Feb 2025
Windows, Mac
4.5
Ulasan: 2
Deskripsi
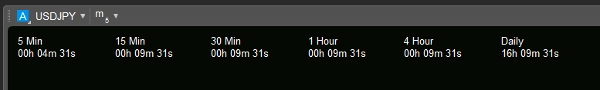
Indikator Hitung Mundur Penutupan Lilin membantu para trader tetap siap dengan menampilkan hitung mundur waktu nyata untuk penutupan kerangka waktu utama: lilin 5m, 15m, 30m, 1H, 4H, dan harian. Alat ini memastikan Anda tidak pernah melewatkan momen aksi harga penting, membantu dengan penentuan waktu perdagangan yang tepat dan pelaksanaan strategi. Tetap kendalikan dan buat keputusan yang tepat dengan pandangan jelas kapan lilin berikutnya akan terbentuk!
Ringkasan
Ringkasan AI
The MTF Candle Countdown indicator provides a real-time countdown to the close of key candle timeframes including 5-minute, 15-minute, 30-minute, 1-hour, 4-hour, and daily intervals. By displaying the remaining time until the next candle forms, it assists traders in precise trade timing and strategy execution. This tool supports better decision-making by clearly indicating when significant price action moments will occur across multiple major timeframes. It is designed for use on bar-based charts and offers visual countdown information to help traders stay prepared for market changes.
Profil indikator
Kategori indikator
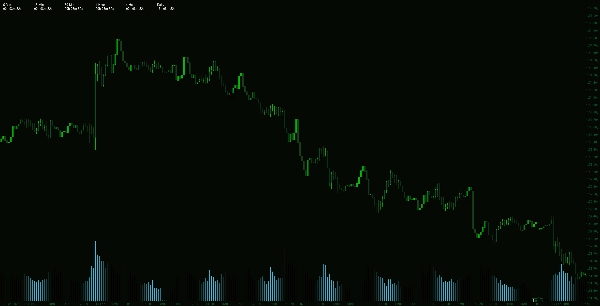
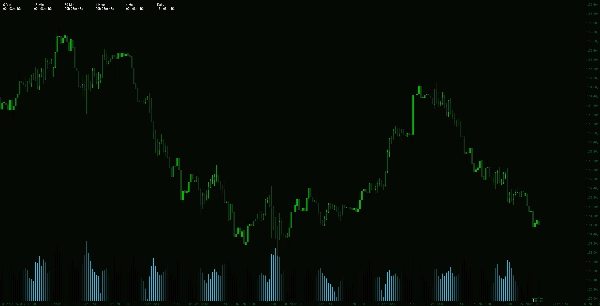
Volume
Tipe output
Visualisasi
Persyaratan data
Hanya batang
Sinyal yang didukung
Breakout
Kekuatan tren
Rentang sesi pembukaan
Ulasan pelanggan
4.5
Ulasan: 2
5 | 50 % | |
4 | 50 % | |
3 | 0 % | |
2 | 0 % | |
1 | 0 % |
Ulasan pelanggan
February 19, 2025
Not perfect, but the workflow felt cleaner. 20 signals gives enough for a first read.
Diskusi
Pertanyaan umum
MSS
BOS
CHOCH
Moving Average
Produk-produk yang tersedia melalui cTrader Store, termasuk bot trading, indikator, dan plugin, disediakan oleh pengembang pihak ketiga serta hanya ditujukan untuk akses teknis dan informasi. cTrader Store bukan broker dan tidak menyediakan saran investasi, rekomendasi pribadi, atau jaminan apa pun tentang kinerja di masa mendatang.


Harga
Sejak 14/01/2025
55
Penjualan
11.36K
Instal gratis