
Deskripsi
Buka pemahaman yang lebih dalam tentang dinamika pasar Forex dengan indikator Relative Currency Strength (RCS) yang komprehensif, yang dirancang khusus untuk platform cTrader.
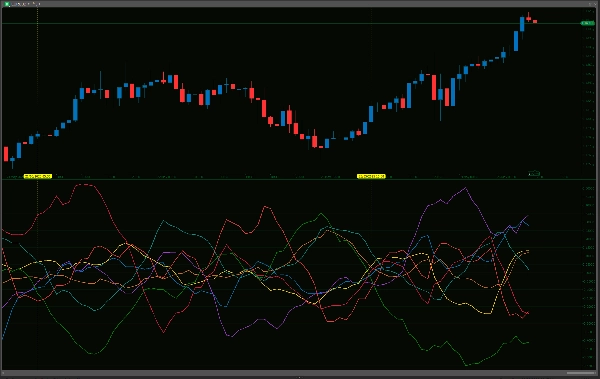
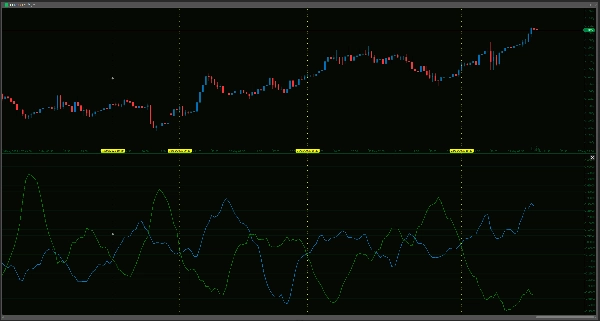
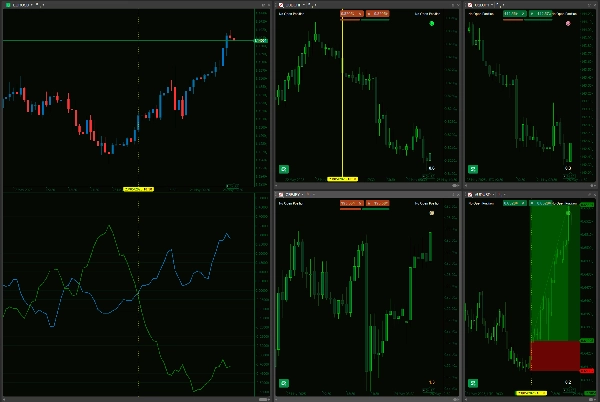
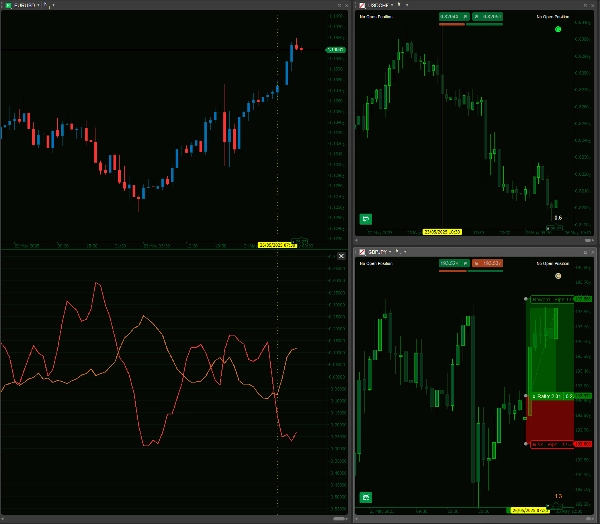
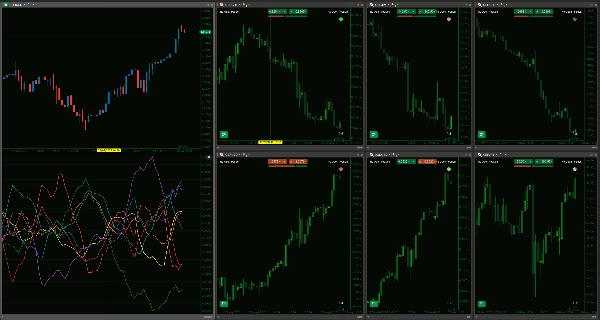
Alat yang kuat ini secara teliti mengevaluasi kinerja individu dari delapan mata uang utama—AUD, USD, EUR, JPY, GBP, CAD, CHF, dan NZD—dengan menganalisis perubahan persentase mereka terhadap satu sama lain di antara 28 pasangan mata uang. Dengan periode lookback dan smoothing yang dapat ditentukan pengguna, Anda dapat menyetel sensitivitas indikator agar sesuai dengan pendekatan trading unik Anda, mulai dari scalping cepat hingga strategi jangka panjang. Output visual yang jelas memungkinkan perbandingan langsung secara sekilas, membantu Anda dengan cepat mengidentifikasi mata uang yang menunjukkan momentum naik yang kuat atau yang menunjukkan tanda-tanda kelemahan, yang dapat sangat berguna dalam memilih pasangan mata uang dengan potensi lebih tinggi untuk strategi Anda. Ini menawarkan cara untuk melampaui analisis pasangan tunggal dan melihat gambaran besar mata uang individu mana yang benar-benar menggerakkan pergerakan pasar.
Namun, sangat penting untuk menggunakan indikator ini dengan pemahaman yang jelas tentang kemampuan dan keterbatasannya. Indikator RCS adalah alat analitis yang canggih, bukan perangkat peramalan yang tak pernah salah atau sistem trading 'set-and-forget' yang lengkap. Perhitungannya didasarkan pada data harga historis dan dimaksudkan untuk melengkapi, bukan menggantikan, metodologi trading Anda yang sudah mapan, yang harus selalu mencakup analisis aksi harga yang menyeluruh, pertimbangan faktor fundamental, dan praktik manajemen risiko yang kuat. Meskipun 'kekuatan' atau 'kelemahan' ditonjolkan oleh garis-garis, pembacaan ini memerlukan interpretasi yang cermat dalam konteks pasar yang lebih luas; misalnya, mata uang yang menunjukkan 'kekuatan' ekstrem mungkin mendekati kondisi overbought atau level resistance utama.
Performa indikator juga dapat berfluktuasi sesuai dengan kondisi pasar yang berlaku (misalnya, mungkin berperilaku berbeda di pasar yang sangat tren dibandingkan dengan pasar yang sideways atau berombak), dan akurasinya bergantung pada platform Anda yang memiliki data historis yang cukup dan bersih untuk semua 28 pasangan mata uang yang terlibat. Meskipun dioptimalkan untuk perhitungan berkelanjutan, pemuatan data awal untuk analisis lintas mata uang yang komprehensif seperti ini dapat membebani sumber daya platform, terutama pada koneksi yang lebih lambat atau perangkat keras yang kurang kuat. Dengan menyediakan perspektif multi-mata uang yang bernuansa, indikator RCS ini ditawarkan sebagai bantuan berharga untuk membantu Anda membuat keputusan trading yang lebih informasi dan strategis serta berpotensi meningkatkan keunggulan Anda di arena Forex yang kompetitif, bukan sebagai solusi mandiri.
Harap periksa bahwa broker Anda menawarkan semua pasangan silang dalam indikator ini agar dapat berfungsi.
--------------------------
Silakan lihat indikator saya yang lain!
https://ctrader.com/products/1181
https://ctrader.com/products/1182
https://ctrader.com/products/1180
https://ctrader.com/products/1015
https://ctrader.com/products/555
https://ctrader.com/products/553
https://ctrader.com/products/554
https://ctrader.com/products/552
https://ctrader.com/products/557
https://ctrader.com/products/845
https://ctrader.com/products/848
https://ctrader.com/products/847
https://ctrader.com/products/846
https://ctrader.com/products/551
https://ctrader.com/products/574
https://ctrader.com/products/573
https://ctrader.com/products/556
https://ctrader.com/products/558
https://ctrader.com/products/559
https://ctrader.com/products/560
Ringkasan
The indicator provides a clear visual representation of currency strength and weakness, enabling traders to identify currencies with strong momentum or signs of weakness at a glance. This multi-currency perspective helps move beyond single-pair analysis to understand which currencies are driving market movements.
The tool relies on historical price data and requires all relevant currency pairs to be available from the broker. Its performance may vary with market conditions, and it is intended to complement, not replace, comprehensive trading strategies that include price action, fundamental analysis, and risk management. Initial data loading can be resource-intensive due to the breadth of cross-currency calculations.
This indicator serves as an analytical aid to support more informed Forex trading decisions by highlighting relative currency strength across major pairs.
Ulasan pelanggan
5 | 33 % | |
4 | 67 % | |
3 | 0 % | |
2 | 0 % | |
1 | 0 % |


