
Deskripsi
Algoritma Pintar Trailing
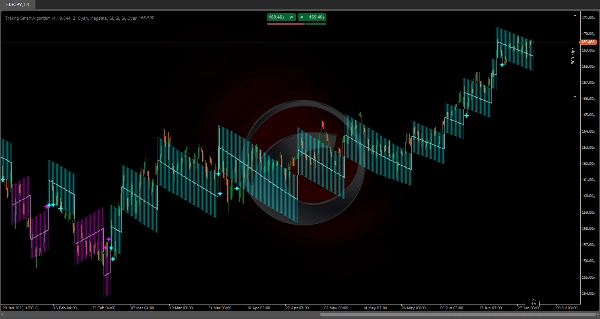
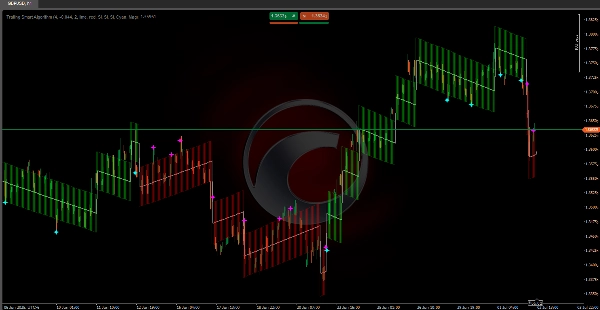
https://chartshots.spotware.com/c/69f0f1d89000b
Menggabungkan algoritma matematis 🧠 yang dirancang khusus untuk secara konsisten melacak harga dalam kondisi pasar apa pun 🌐.
Struktur perhitungannya memastikan garis tren selalu tetap sinkron dengan pergerakan harga, menghindari keterlambatan khas indikator tradisional ⏳.
Berbeda dengan algoritma konvensional, sistem ini menggunakan pengukuran volatilitas yang tepat 📊 dan menerapkan penyesuaian otomatis ⚙️ yang menjamin pelacakan optimal. Perhitungan internalnya dibangun untuk memberikan representasi akurat dari arah pasar, menjaga presisi selama pergerakan cepat ⚡ dan perkembangan tren bertahap 🕊️.
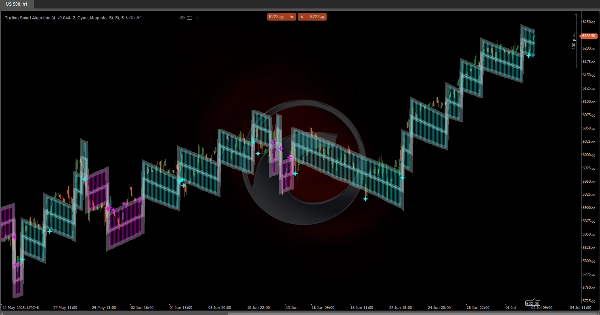
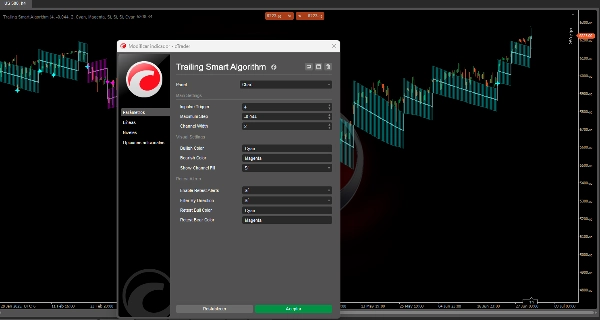
https://chartshots.spotware.com/c/69f0f218591b0
💡 Bagaimana Cara Kerjanya?
Indikator beroperasi menggunakan sistem langkah adaptif yang bergerak ke arah tren dominan.
Ini didasarkan pada tiga komponen utama:
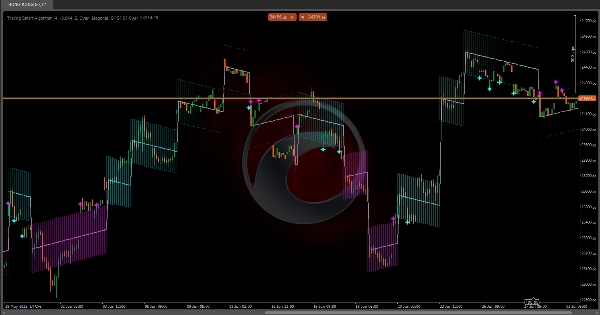
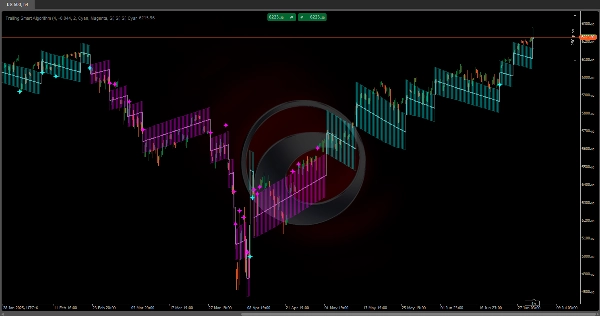
https://chartshots.spotware.com/c/69f0f2b19e4d3
1️⃣ Deteksi Perubahan Tren
Sistem secara terus-menerus memantau harga untuk mendeteksi pergerakan signifikan yang melebihi ambang tertentu (Pemicu Impuls 🎯).
Ketika harga bergerak cukup jauh dari garis tren saat ini, indikator mengenali potensi perubahan arah dan memposisikan ulang garis utamanya.
2️⃣ Trailing Dinamis
Setelah arah ditetapkan, garis tren bergerak langkah demi langkah 🪜 ke arah yang sama dengan pasar.
Setiap langkah dihitung berdasarkan volatilitas saat ini (ATR 📈):
• Di pasar yang lebih volatil, langkah lebih besar 🌊
• Di pasar yang lebih tenang, langkah lebih kecil 🌿
3️⃣ Saluran Volatilitas
Sebuah saluran terbentuk di sekitar garis utama (pita atas dan bawah) yang mewakili zona volatilitas normal 📉📈.
Saluran ini membantu mengidentifikasi apakah harga berperilaku dalam parameter normal atau melakukan pergerakan ekstrem 🚨.
📏 Saluran Volatilitas
• Pita Atas: Batas atas saluran volatilitas
• Pita Bawah: Batas bawah saluran volatilitas
✨ Sinyal Retest
• Bintang Sian 🌟: Harga menyentuh atau melewati pita bawah selama tren naik
• Bintang Magenta ⭐: Harga menyentuh atau melewati pita atas selama tren turun
⚙️ Pengaturan Parameter
🔹 Parameter Utama
Pemicu Impuls (nilai default: 4)
Apa fungsinya?
Menentukan sensitivitas untuk mendeteksi perubahan tren. Ini adalah pengali ATR yang mendefinisikan seberapa banyak harga harus bergerak untuk memicu perubahan arah.
Dampak saat diubah:
• Nilai lebih tinggi (5–8):
- Lebih tahan terhadap perubahan tren 🛡️
- Lebih sedikit sinyal palsu
- Respon lebih lambat terhadap pergeseran nyata
• Nilai lebih rendah (2–3):
- Sensitivitas lebih tinggi 🎯
- Reaksi lebih cepat
- Lebih mungkin menghasilkan sinyal palsu di pasar yang bergerak mendatar
Langkah Maksimum (nilai default: -0.044)
Apa fungsinya?
Membatasi ukuran maksimum setiap langkah yang dapat diambil garis tren. Ini adalah nilai negatif yang berfungsi sebagai batas atas.
Dampak saat diubah:
• Nilai kurang negatif (-0.020 hingga -0.030):
- Langkah lebih besar 🚀
- Pelacakan tren lebih agresif
• Nilai lebih negatif (-0.050 hingga -0.080):
- Langkah lebih kecil, lebih bertahap 🌱
- Pengikut yang lebih konservatif
Lebar Saluran (nilai default: 2)
Apa fungsinya?
Menentukan lebar saluran volatilitas di sekitar garis utama.
Dampak saat diubah:
• Nilai lebih tinggi (3–4):
- Saluran lebih lebar 🟢
- Lebih sedikit sinyal retest
- Toleransi lebih besar terhadap volatilitas
• Nilai lebih rendah (1–1.5):
- Saluran lebih sempit 🔴
- Lebih banyak sinyal retest
- Lebih sensitif terhadap noise
🎨 Parameter Visual
Warna Bullish / Warna Bearish
Menentukan warna untuk tren naik dan tren turun masing-masing.
Tampilkan Isi Saluran
Mengaktifkan atau menonaktifkan isi visual dari saluran volatilitas 🌈.
🔔 Pengaturan Retest
Aktifkan Peringatan Retest
Mengalihkan sinyal retest saat harga menyentuh pita saluran.
Filter Berdasarkan Arah
Saat diaktifkan, hanya menampilkan sinyal retest yang sesuai dengan tren saat ini:
• Dalam tren naik: Hanya sinyal pada pita bawah
• Dalam tren turun: Hanya sinyal pada pita atas
🌟 Ringkasan Sinyal Retest
• Bintang Sian pada Pita Bawah: Potensi pantulan bullish dari dukungan dinamis ✅
• Bintang Magenta pada Pita Atas: Potensi pantulan bearish dari resistensi dinamis ❌
Ringkasan
Ulasan pelanggan
5 | 100 % | |
4 | 0 % | |
3 | 0 % | |
2 | 0 % | |
1 | 0 % |


