
Mô tả
Chỉ báo Pinescriptlabs Store: Pinescriptlabs Store cBots : (cBot) Gold & BTC BreakoutSession Pivots(mới)
Thuật toán Thông minh Theo sau (mới)
Hỗ trợ &
Kháng cự SmartTrend
Đường
Phân tích
Cấu trúc Thị trường
Động
của
Điểm
Quay đầu
Fibonacci
Hồi quy
Tuyến tính
Đa khung thời gian
Gap Giá Trị Công bằng Động lực
Theo dõi
Định hướng Nến
Đa cấp
Tự động
Hỗ trợ và
Kháng cự
Xu hướng
Đường
Tất cả
Hỗ trợ và
Kháng cự
Cấp độ
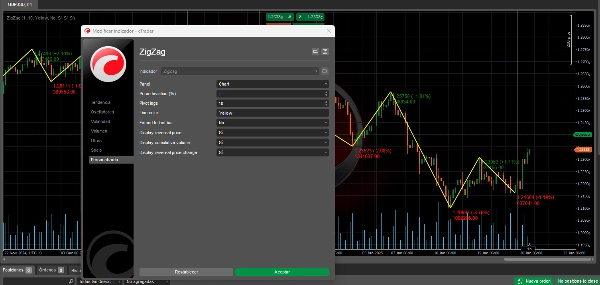
Chỉ báo ZigZag: Đơn giản hóa Xu hướng Thị trường 📉📈
ZigZag là một chỉ báo kỹ thuật giúp xác định các thay đổi xu hướng quan trọng trong một tài sản bằng cách lọc bỏ các biến động nhỏ của thị trường. Mục đích chính của nó là đơn giản hóa việc phân tích giá trực quan bằng cách loại bỏ "tiếng ồn" của các biến động nhỏ.
Cách hoạt động ⚙️
- 📊 Phân tích giá để tìm các điểm quay quan trọng (điểm pivot).
- 📈 Một điểm quay được coi là quan trọng khi giá thay đổi một tỷ lệ phần trăm tối thiểu cụ thể (tham số độ lệch).
- 🔗 Nối các điểm quay này bằng các đường thẳng, tạo thành mô hình "zigzag".
- 🕒 Cập nhật động khi dữ liệu giá mới xuất hiện.
Tiện ích Giao dịch 💡
Xác định Xu hướng 📐
- 🔍 Giúp hình dung hướng chính của thị trường.
- 🚀 Dễ dàng phát hiện các xu hướng tăng và giảm.
- 📏 Làm nổi bật rõ ràng các mức hỗ trợ và kháng cự chính.
Phân tích Mẫu hình 📋
- 🎯 Đơn giản hóa việc nhận diện các mẫu biểu đồ.
- 🕵️♂️ Làm nổi bật các hình thành giá như tam giác, cờ và các mẫu khác.
- 🌊 Tăng cường độ rõ ràng khi nhận biết sóng Elliott.
Quản lý Giao dịch 🎛️
- 🎯 Xác định các điểm vào và ra tiềm năng.
- 🛡️ Giúp xác định mức dừng lỗ dựa trên các điểm pivot trước đó.
- 🎯 Hỗ trợ đặt mục tiêu giá thực tế.
Phân tích Biến động 🌡️
- 📏 Khoảng cách giữa các điểm pivot phản ánh biến động thị trường.
- 🧩 Giúp điều chỉnh chiến lược theo kích thước các biến động.
- ⏳ Phân biệt giữa các giai đoạn tích lũy và xu hướng định hướng.
Xác nhận Tín hiệu ✅
- 🔍 Dùng làm công cụ xác nhận cho các chỉ báo khác.
- 🚪 Xác thực các đột phá của các mức quan trọng.
- 🔗 Có thể kết hợp với các chỉ báo khác để tạo chiến lược mạnh mẽ hơn.
Những Lưu ý Quan trọng 🧠
Nó là Dựa trên Dữ liệu Quá khứ 📅
- ⏪ Các điểm pivot chỉ được xác nhận sau khi biến động xảy ra.
- 🔮 Nó không dự đoán được một cách độc lập.
- ⚖️ Nên sử dụng kết hợp với các chỉ báo khác để ra quyết định.
Điều chỉnh Tham số 🔧
- 🎚️ Độ nhạy phụ thuộc vào tỷ lệ phần trăm độ lệch được đặt.
- 🔍 Tỷ lệ phần trăm nhỏ hơn hiển thị nhiều điểm pivot hơn.
- 🧹 Tỷ lệ phần trăm cao hơn lọc bỏ các biến động nhỏ, chỉ hiển thị các thay đổi quan trọng.
Sử dụng Khung thời gian 🕒
- 🕰️ Hoạt động trên mọi khung thời gian.
- 🔄 Tham số nên được điều chỉnh dựa trên khoảng thời gian giao dịch.
- 🌐 Phân tích trên nhiều khung thời gian cung cấp cái nhìn toàn diện hơn.
📈 Sử dụng chỉ báo ZigZag như một công cụ mạnh mẽ để đơn giản hóa phân tích, xác định xu hướng và cải thiện việc ra quyết định trong hành trình giao dịch của bạn! 🚀
Tóm tắt
Key functionalities include:
- Trend Identification: Visualizes primary market direction, highlights bullish and bearish trends, and marks key support and resistance levels.
- Pattern Analysis: Simplifies recognition of chart patterns such as triangles, flags, and Elliott waves.
- Trade Management: Assists in identifying entry and exit points, setting stop-loss levels based on previous pivots, and establishing realistic price targets.
- Volatility Analysis: Reflects market volatility through pivot distances, aiding strategy adjustments and distinguishing consolidation from trending phases.
- Signal Confirmation: Validates breakouts and complements other indicators for robust trading strategies.
The indicator is retrospective, confirming pivots only after price movements occur, and is not predictive on its own. Sensitivity can be adjusted via the deviation percentage to show more or fewer pivot points. It is compatible with any timeframe and benefits from multi-timeframe analysis for comprehensive market views.
This tool supports analysis across various markets including cryptocurrencies (BTCUSD), commodities (XAUUSD), and others, and integrates with related indicators like RSI, ATR, and Supertrend.
Đánh giá của khách hàng
5 | 50 % | |
4 | 33 % | |
3 | 17 % | |
2 | 0 % | |
1 | 0 % |


![Logo "[Hamster-Coder] Pivot Points (Demo)"](https://cdn.ctrader.com/image/webp/87b54299-8c73-4942-9207-4bc6db824811_31153)

