
Descrição
Indicadores da loja Pinescriptlabs: cBots da loja Pinescriptlabs : (cBot) Gold & BTC BreakoutSession Pivots(novo)
Projeção de Liquidez de Preço ZigZag
Algoritmo Inteligente de Trailing (novo)
Mapa de Liquidação de Alavancagem
Previsão Baseada em Linreg & ATR
Suporte & SmartTrend
Resistência
Linhas
Sistema de Rompimento de Canal
Análise
Dinâmica
da Estrutura
de Mercado
de
Pontos de Virada
Regressão
Linear
de Fibonacci
Multi-temporal
Gap de Valor Justo de Momentum
Gradiente de Tendência Dinâmico
Rastreamento
de Viés
de Vela
Multi-Nível
Rastreador de Extremos Zig-Zag
Linha
de Suporte e
Resistência
de Tendência
Automática
Todos
os Níveis de
Suporte e
Resistência
🌟 Ótimo esforço da equipe para desenvolver este indicador Ctrader! Apoie-nos compartilhando - melhorias visuais incluindo rolagem horizontal em breve!
⚠️ Nota Técnica: Zoom/rolagem manual atualmente necessária para visualização ideal ("Limitação temporária: Funciona melhor em timeframes abaixo de 1H devido a restrições visuais da plataforma Ctrader")
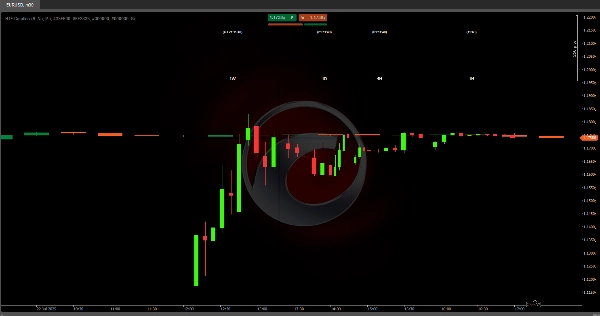
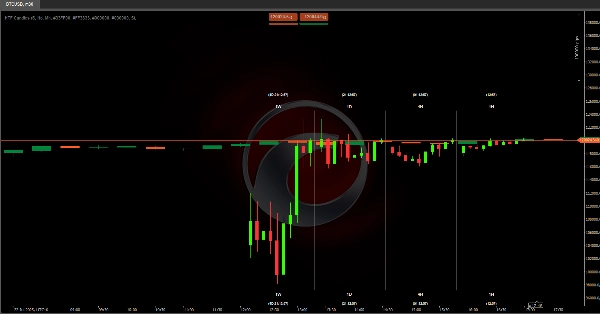
📊 Visualização HTF em Tempo Real
Este algoritmo exibe velas de timeframes superiores (1S, 1D, 4H, 1H) diretamente no seu gráfico de negociação, fornecendo a estrutura completa do mercado de relance - sem necessidade de trocar de janela!
🔍 Análise Rápida
Identifique as principais tendências (direção diária/semanal) enquanto negocia em timeframes inferiores
• Recurso Avançado: Velas HTF atualizam em tempo real - mudanças de cor mostram instantaneamente mudanças de momentum
⚙️ Como Usar
• Ative/desative blocos HTF individuais
• Ajuste o número de velas visíveis (1-10 por timeframe)
💡 Benefícios Revolucionários
Agora você pode:
1️⃣ Antecipar fechamentos chave de velas
2️⃣ Detectar reversões de tendência ao vivo
3️⃣ Monitorar níveis chave em múltiplos timeframes simultaneamente
🚀 Melhorias Futuras
A rolagem horizontal permitirá:
• Análise histórica de padrões HTF
• Comparação da estrutura atual com a passada
• Identificação de zonas chave em timeframes superiores
📚 Exemplos Práticos
• Quando 1S = verde & 1D = vermelho → Mercado está corrigindo dentro de uma tendência de alta → Apenas venda em repiques de resistência chave
• Hierarquia de Tendência: 1S > 1D > 4H > 1H → Sempre negocie com a direção da vela semanal
• Entradas por Confluência:
- Preço no suporte 1D + vela verde 4H emergente = oportunidade de compra
- Resistência no topo 1H + vela vermelha 4H = venda com stop acima do topo
• Padrões de Rompimento: - Se a vela 1H romper o topo anterior antes de fechar (temporizador ativo), espere continuação de alta
Resumo
Users can toggle individual higher timeframe candle blocks on or off and adjust the number of visible candles per timeframe (1 to 10). This facilitates monitoring of key levels and trend directions across multiple timeframes simultaneously. Practical use cases include anticipating candle closings, detecting live trend reversals, and identifying confluence entries based on support, resistance, and candle color changes.
Due to platform visual constraints, manual zoom and scroll are currently required for optimal viewing, especially on timeframes below 1 hour. Planned updates will introduce horizontal scrolling to enable historical pattern analysis, comparison of current versus past structures, and identification of key zones on higher timeframes.
HTF Candles supports traders in aligning trades with higher timeframe trends and enhances multi-timeframe market analysis within a single chart view.


![Logótipo de "[Stellar Strategies] Wave Trend Pro"](https://cdn.ctrader.com/image/webp/5f226fbb-245a-41cd-9cdd-b018257d5e6d_28617)


