الوصف
الوصف
يرسم تلقائيًا مستويات تصحيح فيبوناتشي باستخدام الشمعة السابقة من أي إطار زمني محدد — مباشرة على الرسم البياني الخاص بك. لا حاجة للرسم اليدوي.
كيف يعمل
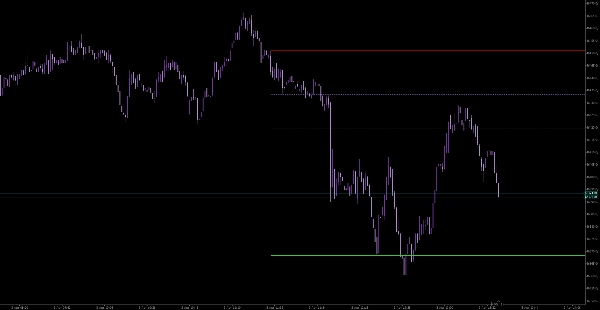
يقرأ المؤشر آخر شمعة مغلقة من الإطار الزمني الذي تختاره (1 ساعة، 4 ساعات، يومي، إلخ) ويرسم أربعة مستويات رئيسية من فيبوناتشي كأشعة ممتدة:
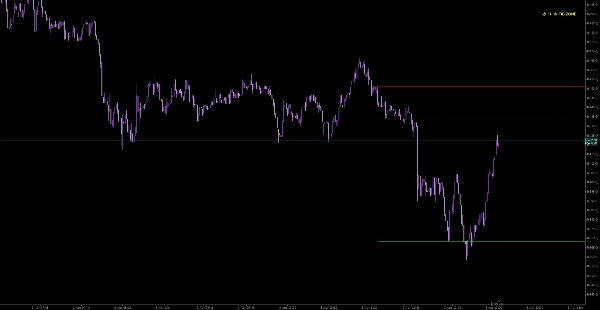
- 0% — أعلى الشمعة (صعودي) أو أدناها (هبوطي)؛ أصل الزخم
- 61.8% — منطقة التصحيح الأولية (تراجع سطحي)
- 78.6% — منطقة التصحيح العميق (منطقة الدخول بدقة)
- 100% — التصحيح الكامل؛ الطرف المقابل للشمعة
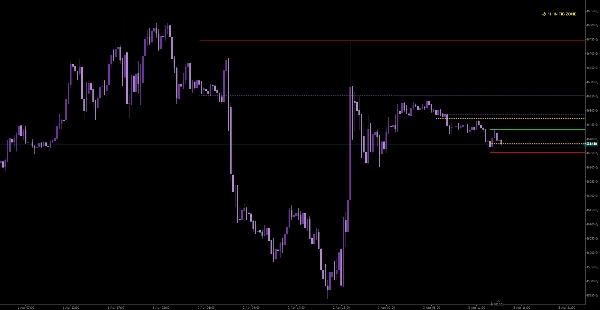
كشف المنطقة الذكية
يُعتبر النطاق 61.8%–78.6% كمنطقة تصحيح مميزة.
عندما يدخل السعر هذه المنطقة، يُفعّل المؤشر:
- تنبيه فوري على الشاشة
- إشعار عبر البريد الإلكتروني مع الاتجاه، الإطار الزمني، السعر، وتفاصيل المنطقة
دعم تعدد الحالات
تشغيل عدة حالات على نفس الرسم البياني (مثل 1 ساعة، 4 ساعات، يومي) دون تداخل أو تعارض. كل حالة تعمل بشكل مستقل بمعرف فريد.
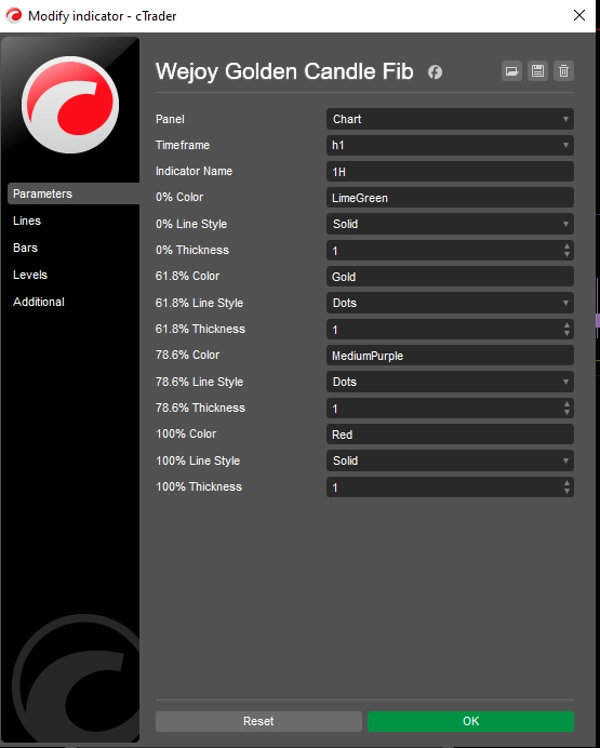
التخصيص
جميع مستويات فيبوناتشي قابلة للتخصيص بالكامل:
- اللون
- نمط الخط (صلب، منقط، متقطع)
- سمك الخط
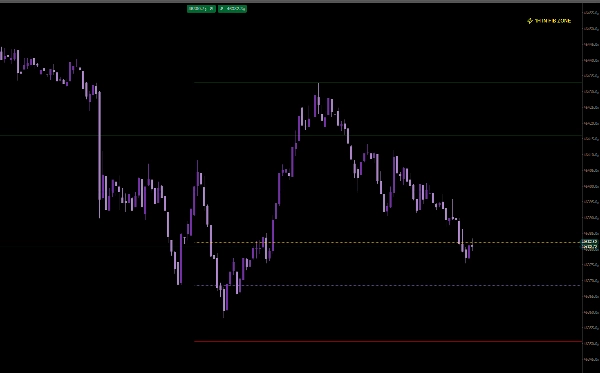
أفضل استخدام مع
XAUUSD (الذهب)، ولكنه متوافق مع جميع الأدوات والأطر الزمنية.
مصمم لـ
المتداولين الذين يركزون على الدخول بدقة، وينتظرون السعر ليعود إلى المنطقة الذهبية قبل تنفيذ الصفقات.


![شعار "High-Low Divergence [Iridio Capital]"](https://cdn.ctrader.com/image/webp/443c4661-7abb-40f1-842f-4b6ec560649b_40914)