

الوصف
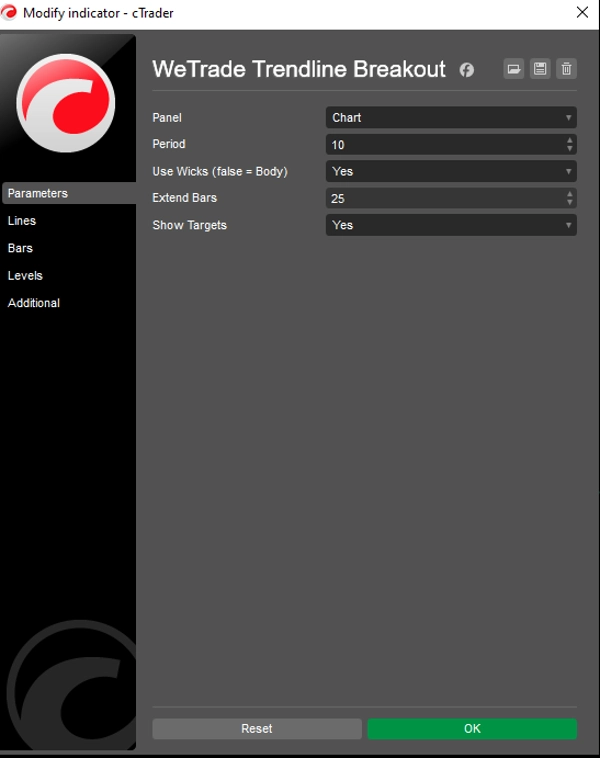
WeTrade Trendline Breakout هو مؤشر ذكي لتحليل حركة السعر يكتشف فرص الاختراق ذات الاحتمالية العالية باستخدام تحليل خطوط الاتجاه الديناميكية. يقوم تلقائيًا بتحديد هيكل السوق، ورسم خطوط اتجاه صالحة، وتوليد إشارات شراء/بيع دقيقة عند اختراق السعر لمستويات رئيسية. تساعد توقعات الأهداف المدمجة والمناطق العازلة القائمة على التقلبات المتداولين على إدارة المخاطر وتعظيم المكافأة بثقة.
اختراقات خطوط الاتجاه مع الأهداف
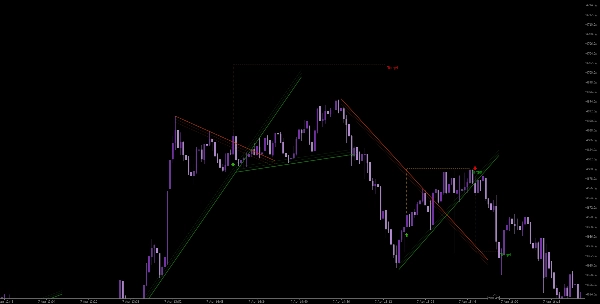
مؤشر ذكي لتحليل حركة السعر يكتشف تلقائيًا اختراقات خطوط الاتجاه ويوفر إشارات دخول واضحة مع مستويات أهداف ديناميكية.
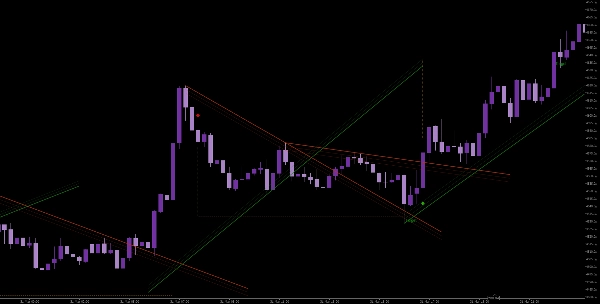
يحدد هذا الأداة القمم والقيعان المحورية لرسم خطوط اتجاه صالحة بناءً على هيكل السوق الحقيقي. عندما يخترق السعر خط مقاومة هابط أو خط دعم صاعد، يولد إشارات شراء أو بيع دقيقة باستخدام منطق تأكيد الإغلاق لتقليل الاختراقات الخاطئة.
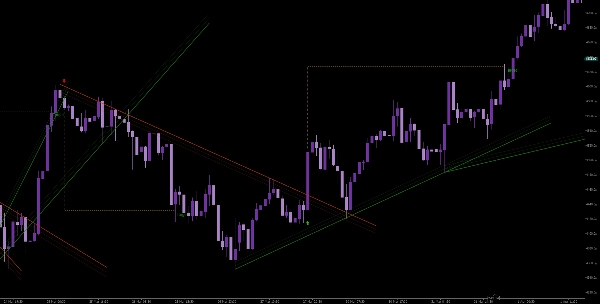
يتضمن المؤشر ترشيح تقلبات تكيفي باستخدام ATR، مما يخلق مناطق عازلة (Z-Bands) حول خطوط الاتجاه لتحسين دقة الاختراق. عند حدوث اختراق صالح، يرسم تلقائيًا أهداف جني الأرباح ومستويات وقف الخسارة، مما يساعد المتداولين على إدارة المخاطر والمكافأة بكفاءة.
الميزات الرئيسية:
- الكشف التلقائي عن خطوط الاتجاه باستخدام هيكل المحاور
- إشارات اختراق مع منطق التأكيد
- مناطق عازلة ديناميكية تعتمد على ATR (Z-Bands)
- تصور مدمج لأهداف جني الأرباح ووقف الخسارة
- عرض نظيف للرسم البياني مع مستويات أهداف اختيارية
- يعمل على جميع الأدوات والأطر الزمنية
مصمم للمتداولين الذين يركزون على الهيكل، الزخم، والتنفيذ المنضبط.
الملخص
Key features include ATR-based dynamic buffer zones (Z-Bands) that adapt to market volatility, enhancing breakout accuracy. Upon a confirmed breakout, the tool automatically plots take-profit targets and stop-loss levels, aiding in risk and reward management. The indicator offers a clean chart display with optional target visualization and supports all instruments and timeframes.
This tool is suitable for traders focusing on market structure, momentum, and disciplined trade execution across various markets including Forex, cryptocurrencies, commodities, indices, and stocks. It provides breakout signals and trend strength insights based on price action and volatility measures.
تقييمات العملاء
5 | 100 % | |
4 | 0 % | |
3 | 0 % | |
2 | 0 % | |
1 | 0 % |


![شعار "[Stellar Strategies] Market Regime Filter"](https://cdn.ctrader.com/image/webp/3bdeba11-7e8b-4e5f-9af9-d562f48df039_28423)

![شعار "Gaussian Channel [Iridio Capital]"](https://cdn.ctrader.com/image/webp/7c039209-5573-4a54-a072-f9528b503103_41960)


