
الوصف
الهدف الرئيسي:
رسم توزيع الحجم حسب مستوى السعر لتحديد:
مناطق السيولة العالية
مناطق السيولة المنخفضة
عدم التوازن بين المشترين والبائعين
هذا المؤشر قوي لفهم هيكل السوق وتحديد المناطق ذات الاحتمالية العالية للعمليات! 🎯
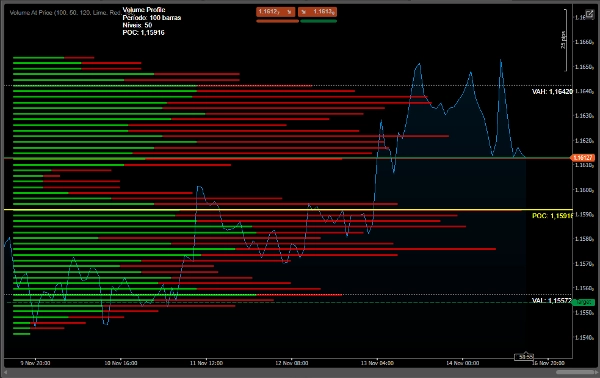
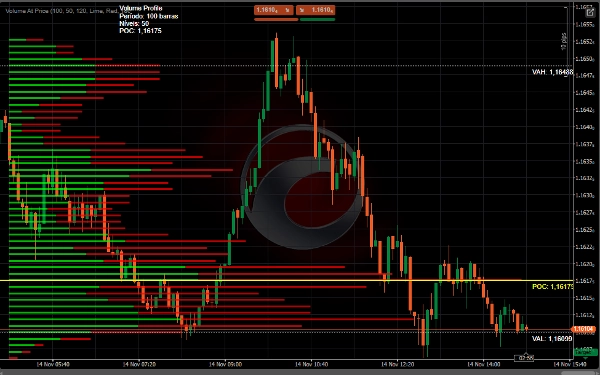
1. POC (نقطة التحكم)
Linha Amarela - السعر بأعلى حجم تداول
منطقة السيولة والسعر الأكبر
دعم/مقاومة طبيعية
2. منطقة القيمة
خطوط بيضاء - المنطقة التي تم فيها تداول 70% من الحجم
VAH (قيمة المنطقة العليا) - الحد الأعلى
VAL (قيمة المنطقة السفلى) - الحد الأدنى
منطقة توازن السوق
3. نوى الحجم
🟢 أخضر - حجم الشراء المهيمن
🔴 Vermelho - حجم البيع المهيمن
طول الشريط = شدة الحجم
📊 استخدام الاستراتيجيات
1. تحديد الدعم والمقاومة
• تعمل POC كدعم/مقاومة ديناميكي
• تحدد منطقة القيمة منطقة التوازن
• حواف مهمة لملف الدعم/المقاومة
2. تحليل الاختراق
• اختراق فوق VAH → اتجاه صاعد
• اختراق تحت VAL → اتجاه هابط
• حجم غير اختراقي يؤكد الحركة
3. نقاط الدخول
• شراء: إعادة اختبار VAL بحجم مشتري
• بيع: إعادة اختبار VAH بحجم بائع
• التراجع: التداول ضد أطراف الملف
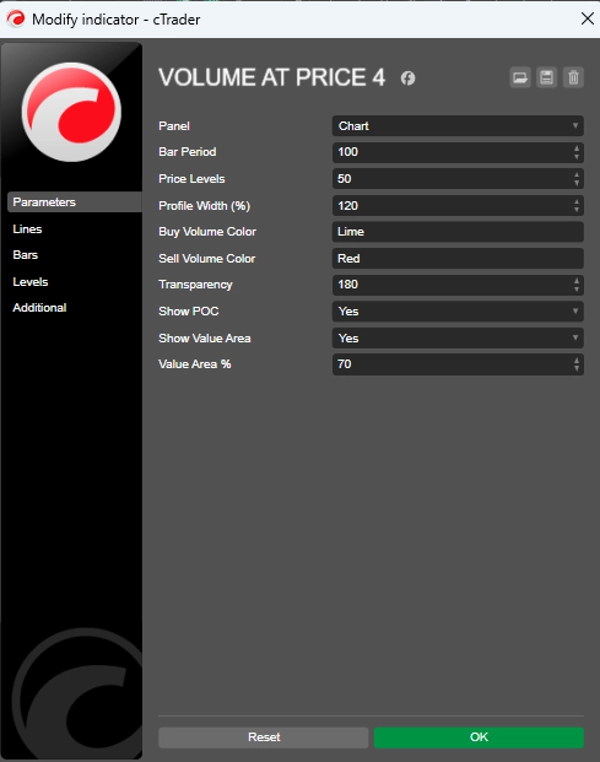
⚙️ الإعدادات الموصى بها
للتداول اليومي
csharp
الفترة = 50-100
مستويات السعر = 50
عرض الملف = 120%
نسبة منطقة القيمة = 70
للتداول المتأرجح
csharp
الفترة = 100-200
مستويات السعر = 80
عرض الملف = 150%
نسبة منطقة القيمة = 70
✅ الإيجابيات:
يحدد الدعم/المقاومة الديناميكي
يعرض نية السوق (الحجم)
يكشف عن مناطق السيولة المهمة
تصور واضح لعدم التوازن
Contagem current volume ticks
الملخص
- Point of Control (POC): The price level with the highest traded volume, acting as a dynamic support or resistance.
- Value Area: The price range where 70% of volume is traded, defined by Value Area High (VAH) and Value Area Low (VAL), representing market balance zones.
- Volume Cores: Colored bars indicating dominant buying (green) or selling (red) volume, with bar length reflecting volume intensity.
The indicator supports strategies like identifying support and resistance levels, breakout analysis (trend direction based on VAH and VAL breaks), and entry points (buy near VAL with buyer volume, sell near VAH with seller volume, or fade at profile extremes).
Recommended settings vary by trading style: for day trading, shorter periods and narrower profiles; for swing trading, longer periods and wider profiles. This tool aids in visualizing liquidity, market intent, and volume imbalances to inform trading decisions.
تقييمات العملاء
5 | 0 % | |
4 | 50 % | |
3 | 50 % | |
2 | 0 % | |
1 | 0 % |


