
설명
지표 이름: Beautiful MACD – 고급 버전
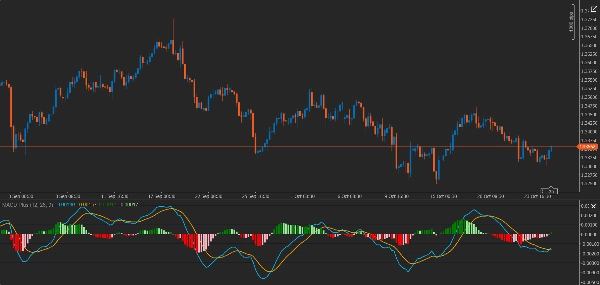
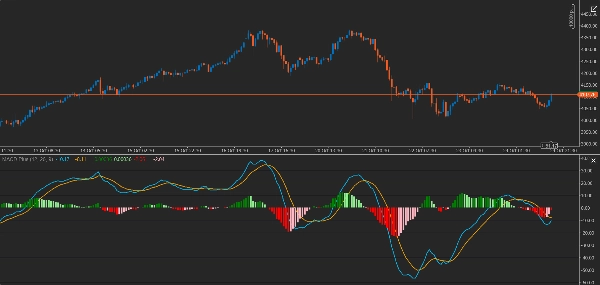
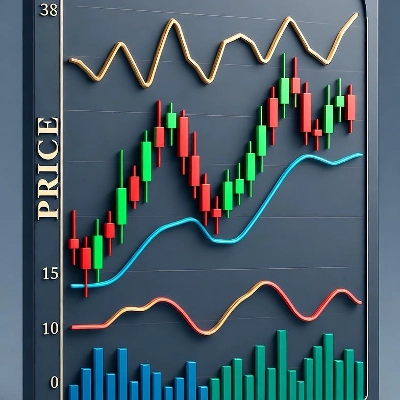
Beautiful MACD는 시장 추세 분석을 단순화하기 위해 시각적으로 매력적인 기능을 갖춘 고전적인 MACD 지표의 고급 버전입니다.
특징:
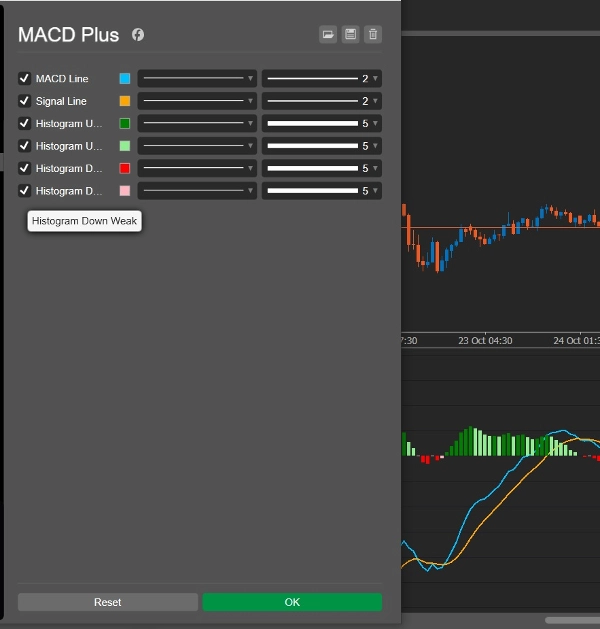
- 사용자 지정 가능한 색상과 두께의 MACD 및 신호선
- 모멘텀 강도를 나타내는 네 가지 히스토그램 유형:
-
- Histogram Up Strong – 강한 상승 움직임
- Histogram Up Weak – 약한 상승 움직임
- Histogram Down Strong – 강한 하락 움직임
- Histogram Down Weak – 약한 하락 움직임
- 진입 및 청산 신호를 위한 쉬운 시각적 분석
- 모든 타임프레임과 자산 클래스에 적합
사용 사례:
- 추세 강도 변화 식별
- 최적의 진입 및 청산 지점 감지
- 기술 분석가 및 스캘퍼에게 이상적
-*-*-*-*-*-*-*-*-*-*-*-*-*-*-*-*-*-*-*-*-*-*-*-*-*-*-*-*-*-*-*-*-*-*-*-*-
نام اندیکاتور: Beautiful MACD – نسخه پیشرفته
توضیح کامل:
اندیکاتور Beautiful MACD نسخه ارتقاء یافته کلاسیک MACD است که با ویژگیهای بصری جذاب، تحلیل روند و قدرت حرکت بازار را آسانتر میکند.
ویژگیها:
- دو خط اصلی MACD و Signal با رنگهای متفاوت و ضخامت قابل تنظیم
- چهار نوع هیستوگرام برای نشان دادن قدرت حرکت:
-
- Histogram Up Strong: صعود قوی
- Histogram Up Weak: صعود ضعیف
- Histogram Down Strong: نزول قوی
- Histogram Down Weak: نزول ضعیف
- تحلیل بصری ساده برای تشخیص سیگنالهای ورود و خروج
- مناسب برای تمامی تایمفریمها و انواع داراییها
کاربرد:
- تشخیص تغییرات قدرت روند
- تشخیص نقاط ورود و خروج بهینه
- مناسب برای تحلیلگران تکنیکال و اسکالپرها
요약
AI 요약
MACD Plus is an enhanced version of the classic MACD (Moving Average Convergence Divergence) indicator designed to facilitate market trend analysis through improved visual features. It displays MACD and Signal lines with customizable colors and thickness, alongside four distinct histogram types that represent momentum strength: strong upward, weak upward, strong downward, and weak downward movements. This visual differentiation aids in identifying changes in trend strength and supports easier interpretation of entry and exit signals. The indicator is suitable for all timeframes and asset classes, making it applicable across various markets including Forex and cryptocurrencies. It is particularly useful for technical analysts and scalpers seeking to detect optimal trading points and assess momentum dynamics.
지표 프로필
고객 리뷰
5.0
리뷰: 2
5 | 100 % | |
4 | 0 % | |
3 | 0 % | |
2 | 0 % | |
1 | 0 % |
고객 리뷰
February 6, 2026
i love this macd its shows straight the coulours i need and for free i cant thank the maker enough up trend nice green down trend nice red love this one thank you for this indicator
상담
자주 묻는 질문(FAQ)
Forex
Signal
Breakout
Crypto
MACD
트레이딩 봇, 지표, 플러그인 등 cTrader Store에서 제공되는 상품은 제3자 개발자에 의해 제공되며, 이는 단순히 정보 및 기술적 접근을 목적으로 제공된 것입니다. cTrader Store는 중개인이 아니며, 투자 조언, 개인별 추천 또는 향후 성과에 대한 어떠한 보장도 제공하지 않습니다.
이 작성자의 상품 더 보기


가격
가입일 02/10/2025
1.91K
무료 설치