الوصف
متوسط متحرك Tillson T3 (مُنعّم تكيفي)
نظرة عامة:
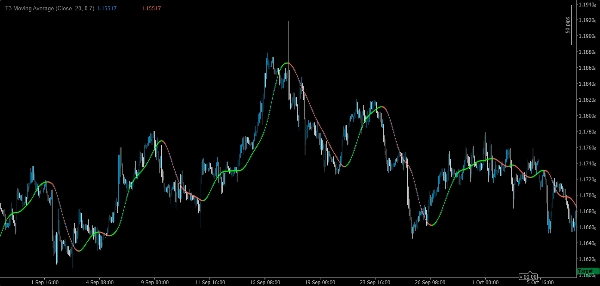
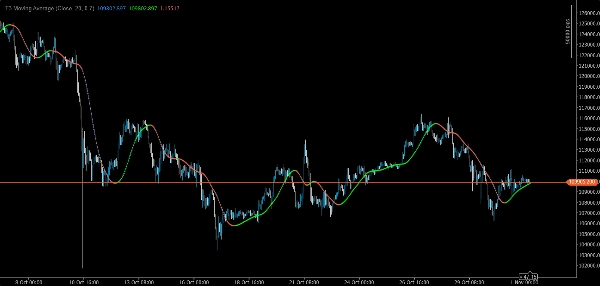
يعد Tillson T3 متوسطًا متحركًا من الجيل التالي مصممًا لتقديم نعومة استثنائية مع تأخير ضئيل. على عكس SMA أو EMA التقليدي، يطبق T3 سلسلة من المتوسطات الأسية مع عامل حجم قابل للضبط، مما يمنح المتداولين خطًا سلسًا ومتجاوبًا في نفس الوقت. وهذا يجعله مثاليًا لتحديد الاتجاهات، وتصفيه الضوضاء، وتنعيم المؤشرات الأخرى.
الميزات الرئيسية:
• ⚡ تقليل التأخير: يستجيب بشكل أسرع لتغيرات السعر مقارنة بـ SMA/EMA مع تجنب الإشارات الخاطئة.
• 🎯 منحنى فائق النعومة: يصفّي ضوضاء السوق، مما يجعل اتجاه الاتجاه أوضح.
• 🔧 عامل حجم قابل للتخصيص: ضبط الاستجابة مقابل النعومة (0.3–0.9).
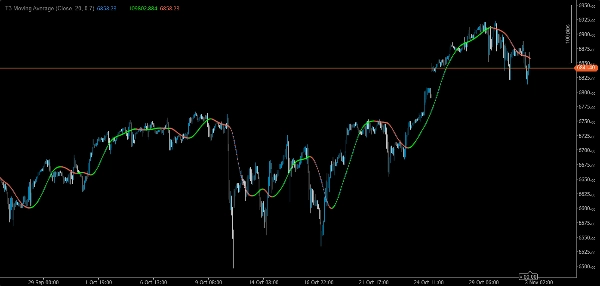
• 📊 وضوح بصري: يتم تمييز مراحل الصعود والهبوط بنقاط ملونة.
• 🔄 حالات استخدام متعددة: يمكن استخدامه كمرشح اتجاه مستقل، أو كخط أساس لإيقاف الخسارة المتحرك، أو كمُنعّم لمؤشرات التذبذب مثل RSI/MACD.
• 🛠️ مُحسّن لـ cTrader: خفيف الوزن، لا يعيد الرسم، ومتوافق مع أطر زمنية متعددة.
لماذا تختار هذا المؤشر؟
يُعتبر T3 على نطاق واسع كواحد من أكثر تقنيات التنعيم فعالية في التحليل الفني. يساعد المتداولين على البقاء في الاتجاهات المربحة لفترة أطول، وتجنب الإشارات الخاطئة في الأسواق المتقلبة، والتكيف مع أنماط التداول المختلفة. سواء كنت متداول سكالبينج، أو متداول تأرجحي، أو مطور أنظمة، يوفر T3 ميزة موثوقة.
الأفضل لـ:
• المتداولين الباحثين عن مرشح اتجاه منخفض التأخير
• المطورين الذين يحتاجون إلى مُنعّم معياري لاستراتيجيات مخصصة
• أي شخص يرغب في مؤشر بمستوى احترافي يتفوق على المتوسطات القياسية
الملخص
Key features include faster reaction to price changes while minimizing false signals, visual clarity through color-coded points indicating rising and falling phases, and versatile applications such as standalone trend filtering, baseline for trailing stops, or smoothing other oscillators like RSI and MACD. The indicator is optimized for the cTrader platform, ensuring lightweight performance, non-repainting behavior, and compatibility across multiple timeframes.
The T3 Moving Average supports a wide range of markets including forex pairs (EURUSD, GBPUSD), cryptocurrencies (BTCUSD), indices (NAS100, US 500), commodities (XAUUSD), and stocks. It is suitable for various trading styles, from scalping to swing trading, and for developers seeking a modular smoother for custom strategies.