
KaufmanEfficiencyRatio
مؤشر
78 التنزيلات
الإصدار 1.0، Sep 2025
Windows, Mac
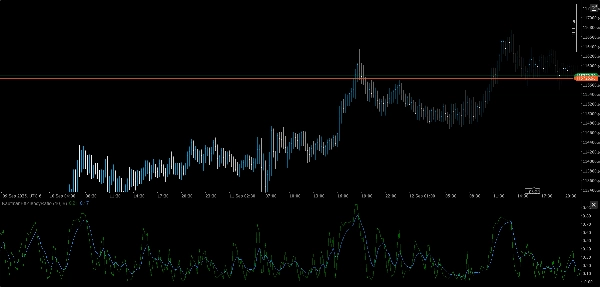
⚡ نسبة كفاءة كوفمان (KER)
وضوح الاتجاه، مُقَدر كميًا.
نسبة كفاءة كوفمان (KER) هي أداة دقيقة لقياس مدى كفاءة تحرك السعر من النقطة أ إلى ب—دون أن تضيع في الضوضاء. سواء كنت تتحقق من شروط الاختراق أو تصفي التشويش الجانبي، تمنحك KER نتيجة واضحة بين 0 و 1 تعكس النية الاتجاهية مقابل التقلب.
🔍 ما الذي تفعله
- تحسب نسبة كفاءة كوفمان:
- تُخرج قيمة مُطَبَّعة من 0 (ضوضاء صافية) إلى 1 (اتجاه مثالي)
- تُبرز الأنظمة الاتجاهية مقابل غير الاتجاهية بدون أي غموض
- مثالية للطبقات التكيفية، مرشحات الأنظمة، وبوابات الإشارة
🛠️ الميزات الرئيسية
- مدير إدخال معياري لمصادر متعددة الأطر الزمنية
- متوافق عبر الأصول: الفوركس، العملات المشفرة، المؤشرات، الأسهم
- منطق خفيف الوزن وواقعي بدون تأخير في التنعيم
- توصيل وتشغيل مع هيكلية مجموعتك الحالية
🎯 حالات الاستخدام
- التحقق من الاتجاه: تأكيد التحيز الاتجاهي قبل تنفيذ الإشارة
- تصفية الضوضاء: كبح الإدخالات أثناء حركة السعر غير الفعالة
- كشف النظام: اقتران مع طبقات واعية بالتقلبات لتحولات أذكى
- بناء الاستراتيجية: استخدامه كمقياس أساسي في منطق الاختراق، الزخم، أو التحيز
💡 مكافأة
KER مجاني، سريع، وفعال بلا رحمة—تمامًا مثل كودك. لا زخرفة، لا مرشحات. فقط نية السوق الخام، مُقطرة.
ملف تعريف المؤشر
0.0
التقييمات: 0
تقييمات العملاء
لا توجد تقييمات لهذا المنتج حتى الآن. هل جرَّبته بالفعل؟ كن أول من يخبر الآخرين!
Breakout
Scalping
AI
يتم توفير المنتجات المتاحة من خلال cTrader Store، بما في ذلك روبوتات التداول والمؤشرات والإضافات، من قبل مطوري الطرف الثالث وإتاحتها لأغراض الوصول المعلوماتي والفني فقط. cTrader Store ليس وسيطًا ولا يقدم نصائح استثمارية أو توصيات شخصية أو أي ضمان للأداء المستقبلي.


![شعار "[Stellar Strategies] Market Session Ultimate"](https://cdn.ctrader.com/image/webp/61ffd537-0125-4246-9e72-42eca1791d64_28232)


25
المبيعات
2.1K
التثبيتات المجانية