
PrevDayProjection
Indicatore
217 download
Versione 1.0, Sep 2025
Windows, Mac
Descrizione
Livelli di Proiezione del Giorno Precedente
Sblocca il trading di precisione con proiezioni dinamiche di Fibonacci basate sull’azione del prezzo di ieri.
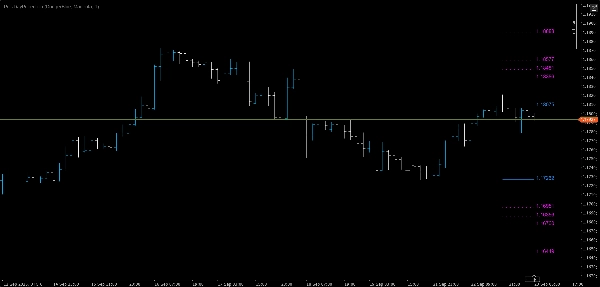
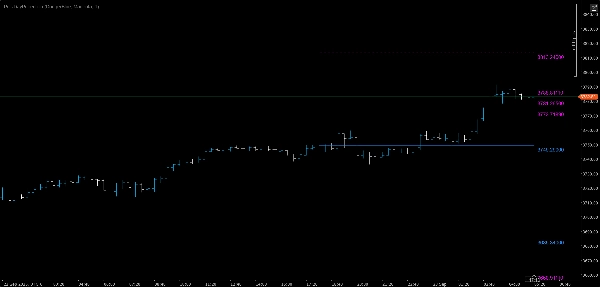
Questo indicatore calcola automaticamente il massimo e il minimo del giorno precedente, determina il range, e poi proietta livelli di Fibonacci sia sopra che sotto quel range — offrendoti punti di riferimento immediati per potenziali zone di supporto, resistenza e breakout.
Caratteristiche Principali
- 📅 Rilevamento automatico del massimo e minimo del giorno precedente
- 📏 Proiezioni di Fibonacci basate sul range ai livelli 38,2%, 50%, 61,8% e 100%
- 🔼 Sopra il massimo precedente: Quattro livelli di Fibonacci per obiettivi di continuazione rialzista
- 🔽 Sotto il minimo precedente: Quattro livelli di Fibonacci per obiettivi di continuazione ribassista
- 🎯 Linee solo per segmento a partire dalla prima barra di oggi — nessun ingombro sul grafico
- 🏷 Etichette di prezzo sul bordo destro per un riferimento rapido e immediato
- 🎨 Colori personalizzabili e spessore delle linee per adattarsi al tuo stile di grafico
Perché i Trader lo Amano
- Chiara mappa intraday: Sapere esattamente dove si trovano i livelli chiave prima dell’inizio della sessione.
- Analisi a doppia direzione: Pianifica sia i movimenti al rialzo che al ribasso.
- Automazione che fa risparmiare tempo: Nessun disegno manuale o ricalcolo necessario.
- Funziona su qualsiasi timeframe: Dal scalping al swing trading.
Perfetto Per
- Trader giornalieri che cercano obiettivi di breakout precisi
- Trader swing che identificano zone chiave di ritracciamento
- Chiunque utilizzi livelli di Fibonacci come parte della propria strategia
💡 Suggerimento: Combina questo indicatore con i tuoi strumenti preferiti di momentum o volume per confermare entrate e uscite intorno a questi livelli proiettati.
Riepilogo
Riepilogo AI
PrevDayProjection is a technical indicator designed for trading platforms that automatically calculates the previous trading day’s high and low prices, determines the range, and projects Fibonacci levels based on that range. It generates key Fibonacci retracement and extension levels at 38.2%, 50%, 61.8%, and 100% both above the previous high and below the previous low. These levels serve as potential support, resistance, and breakout zones.
The indicator displays segment-only lines starting from the current day’s first bar to avoid chart clutter and includes price labels at the right edge for quick reference. Users can customize colors and line thickness to fit their chart style. It supports any timeframe, making it suitable for scalping, day trading, and swing trading.
PrevDayProjection is applicable across multiple markets including Forex, Indices, Commodities, and Crypto, with specific tags indicating symbols like EURUSD, XAUUSD (gold), and NAS100. It provides traders with a clear intraday roadmap and dual-direction analysis to plan for both bullish and bearish moves. The tool automates manual calculations, saving time and enhancing precision in identifying breakout targets and retracement zones.
Profilo indicatore
Recensioni dei clienti
0.0
Recensioni: 0
Recensioni dei clienti
Questo prodotto non ha ancora ricevuto recensioni. L'hai già provato? Fallo sapere agli altri per primo!
Discussioni
Domande frequenti
Forex
Indices
EURUSD
Commodities
Crypto
XAUUSD
NAS100
I prodotti disponibili tramite cTrader Store, inclusi bot di trading, indicatori e plugin, sono forniti da sviluppatori terzi e resi disponibili esclusivamente a scopo informativo e di accesso tecnico. cTrader Store non è un broker e non fornisce consulenze in materia di investimento, raccomandazioni individualizzate o garanzie di risultati futuri.


Potrebbe interessarti anche


![Logo di "[Stellar Strategies] Wave Trend Pro"](https://cdn.ctrader.com/image/webp/5f226fbb-245a-41cd-9cdd-b018257d5e6d_28617)

![Logo di "[Stellar Strategies] Market Session Ultimate"](https://cdn.ctrader.com/image/webp/61ffd537-0125-4246-9e72-42eca1791d64_28232)


Prezzo
26
Vendite
2.14K
Installazioni gratuite