
AsiaSession
Indikator
226 muat turun
Versi 1.0, Dec 2025
Windows, Mac
Penerangan
📜 Penerangan
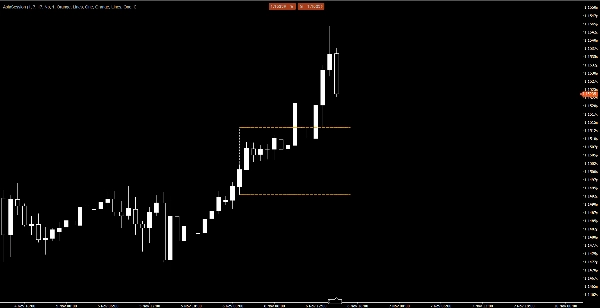
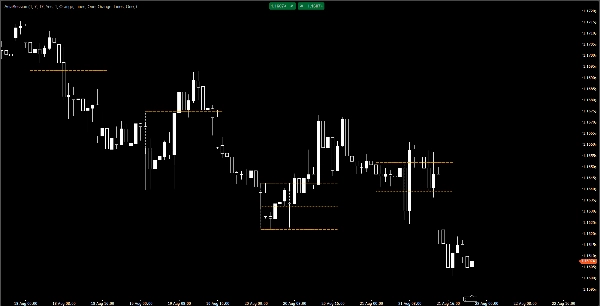
Penunjuk AsiaSession adalah alat khusus untuk platform cTrader yang menyerlahkan julat sesi dagangan Asia. Ia melukis kotak sesi lengkap dengan sempadan menegak untuk masa mula dan tamat, serta garis mendatar untuk paras tinggi, rendah, dan tengah. Ini menjadikannya sangat berguna untuk pedagang yang menggunakan Konsep Wang Pintar (SMC) dan strategi ICT, di mana paras sesi Asia sering bertindak sebagai zon kecairan.
✨ Ciri Utama
- Melukis kotak sesi lengkap:
-
- Garis kiri (mula sesi)
- Garis kanan (tamat sesi)
- Garis atas (tinggi Asia)
- Garis bawah (rendah Asia)
- Garis tengah (tengah Asia)
- Memanjangkan garis tinggi/rendah/tengah ke masa depan sehingga masa yang ditetapkan pengguna
- Boleh dikonfigurasikan warna, gaya, dan ketebalan untuk setiap garis
- Pilihan untuk menunjukkan hanya hari semasa atau termasuk sesi sejarah
- Parameter offset UTC terbina dalam untuk pelarasan zon waktu
- Secara automatik melangkau hujung minggu untuk mengelakkan sesi palsu
- Reka bentuk bersih berorientasikan objek dengan enums, pembantu, model, dan perkhidmatan
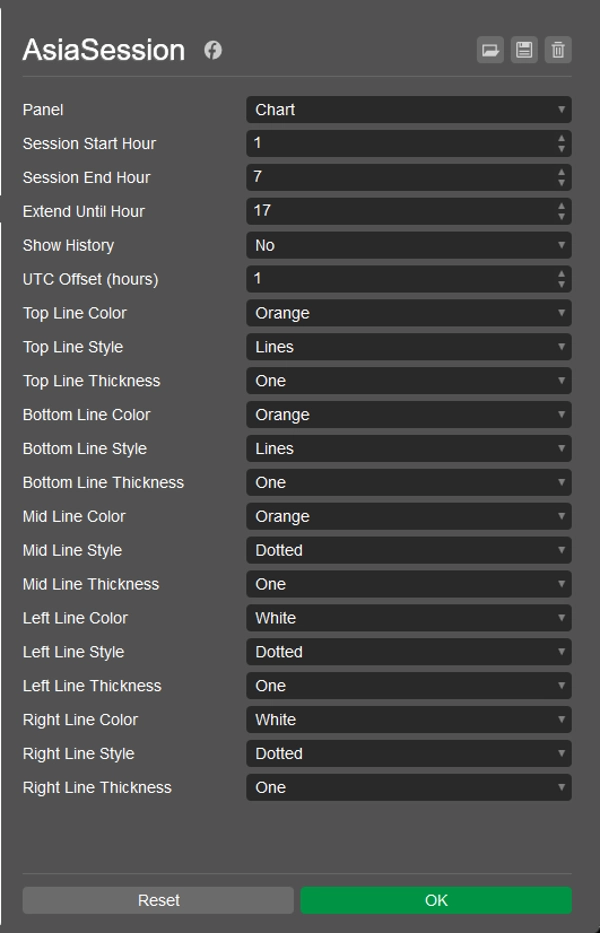
⚙️ Parameter
- Jam Mula Sesi / Jam Tamat – menentukan sempadan sesi Asia
- Lanjutkan Sehingga Jam – kawal berapa lama garis memanjang ke masa depan
- Tunjukkan Sejarah – togol kotak sesi sejarah
- Offset UTC – laraskan kepada zon waktu tempatan atau masa pelayan broker anda
- Penyesuaian garis – tetapkan warna, gaya, dan ketebalan untuk setiap sempadan
📈 Penggunaan
- Pasang penunjuk dalam cTrader Automate.
- Lampirkannya pada carta anda.
- Laraskan parameter untuk padankan zon waktu dagangan dan keutamaan anda.
- Dayakan Tunjukkan Sejarah untuk memvisualisasikan sesi lalu.
📦 Lesen
Diterbitkan di bawah Lesen MIT – bebas digunakan, diubah suai, dan diedarkan.
Ringkasan
Ringkasan AI
AsiaSession is a custom indicator for the cTrader platform designed to visualize the Asian trading session range. It draws a complete session box on the chart, including vertical lines marking the session start and end times, and horizontal lines indicating the session’s high, low, and mid levels. These lines can be extended into the future up to a user-defined time. The indicator supports customizable colors, styles, and thickness for each line, allowing traders to tailor the display to their preferences.
Key parameters include session start and end hours, extension duration for the lines, an option to show historical sessions or only the current day, and a built-in UTC offset for timezone adjustments. The indicator automatically skips weekends to avoid displaying false sessions. Its architecture is object-oriented, facilitating clean and efficient operation.
AsiaSession is particularly useful for traders applying Smart Money Concepts (SMC) and ICT strategies, where Asian session levels often serve as liquidity zones. Installation involves adding the indicator to cTrader Automate and configuring parameters to match the trader’s timezone and preferences. The product is published under the MIT License, permitting free use, modification, and distribution.
Profil indikator
Ulasan pelanggan
0.0
Ulasan: 0
Ulasan pelanggan
Belum ada ulasan untuk produk ini. Anda sudah mencuba produk tersebut? Jadilah yang pertama untuk berkongsi pendapat anda!
Perbincangan
Soalan Lazim
Forex
EURUSD
SMC
Produk yang tersedia melalui cTrader Store, termasuk bot dagangan, indikator dan plugin, disediakan oleh pembangun pihak ketiga dan diberikan akses untuk tujuan maklumat dan teknikal sahaja. cTrader Store bukan broker dan tidak memberikan nasihat pelaburan, syor peribadi atau sebarang jaminan prestasi masa hadapan.
Lebih banyak produk daripada penulis ini


Harga
Sejak 24/09/2025
369
Pemasangan percuma