Penerangan
SmartTrendScanner
Gambaran Keseluruhan
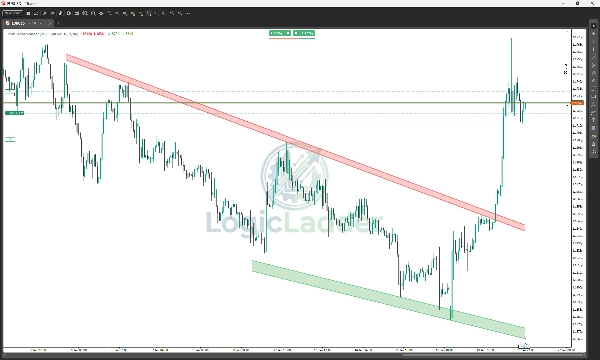
SmartTrendScanner adalah penunjuk cTrader tahap profesional yang direka untuk mengautomasikan seni subjektif analisis tren. Berbeza dengan penunjuk tradisional yang melukis garis tren harga tunggal yang nipis, SmartTrendScanner mengenal pasti dan memvisualisasikan Zon Awan Bekalan & Permintaan yang dinamik.
Dikuasakan oleh algoritma "Best-Fit", ia mengimbas tindakan harga sejarah untuk mencari titik sambungan yang paling signifikan secara matematik, melukis saluran berisi yang mewakili sebenar kawasan sokongan dan rintangan.
Ciri Utama
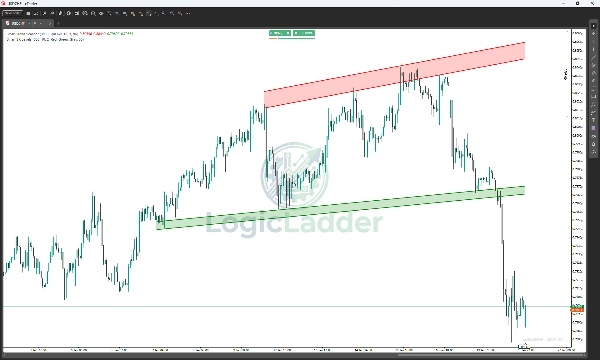
- Zon Awan Dinamik: Menggantikan garis nipis dengan saluran "awan" berisi, secara visual meliputi seluruh julat sentuhan harga (wick dan badan) untuk mengelakkan penipuan.
- Pengesanan Pivot Pintar: Secara automatik mengenal pasti Swing High dan Swing Low utama berdasarkan tetapan kepekaan tersuai anda.
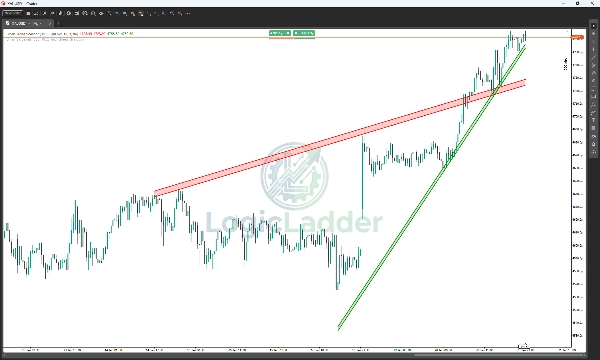
- Algoritma Best-Fit: Penunjuk mencipta ribuan garis tren berpotensi di latar belakang dan menapisnya untuk memaparkan hanya zon terkuat dan paling dihormati yang paling hampir dengan harga semasa.
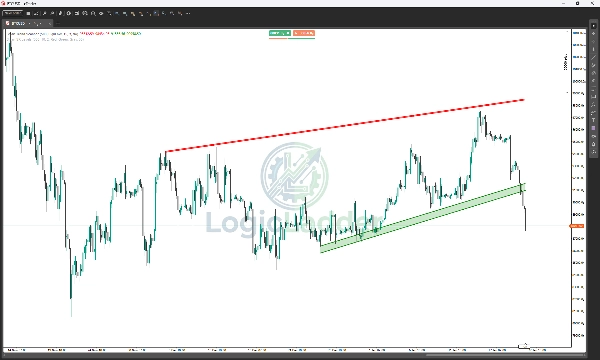
- Penapis Kestabilan: Logik terbina dalam memeriksa struktur yang rosak, memastikan anda tidak berdagang berdasarkan tahap yang tidak sah atau lapuk.
- Amaran Masa Nyata: Jangan lepaskan pergerakan. Dapatkan pemberitahuan popup dan bunyi segera apabila harga melepasi zon atau menguji semula tahap.
- Boleh Disesuaikan Sepenuhnya: Laraskan ketelusan awan, warna, kekuatan pivot, dan sejarah tinjauan untuk menyesuaikan gaya perdagangan anda (Scalping, Perdagangan Harian, atau Swing).
Cara Ia Berfungsi
- Mengimbas Sejarah: Penunjuk melihat kembali sejumlah bar yang ditetapkan pengguna (contoh: 300 bar) untuk mencari titik pivot fraktal.
- Menyambungkan Titik: Ia menguji sambungan antara pivot untuk mencari cerun tren yang sah.
- Mengesahkan Zon: Ia memeriksa sama ada harga telah "menyentuh" garis yang dijangka cukup kali (Sentuhan Min) tanpa memecahkannya dengan ketara dalam masa terdekat.
- Melukis Awan: Setelah tren yang sah ditemui, ia melukis awan lutsinar antara sentuhan wick tertinggi dan sentuhan badan terendah, mencipta "Zon Tindakan."
Panduan Tetapan
- Bar untuk Digunakan: Sejauh mana imbasan melihat ke belakang dalam sejarah (Default: 300). Tingkatkan ini untuk perdagangan swing jangka panjang.
- Kekuatan Pivot: Kepekaan pengesanan fraktal. Nombor yang lebih tinggi (contoh: 15+) mencari titik struktur utama; nombor yang lebih rendah (contoh: 5) mencari struktur dalaman kecil.
- Pengesahan Pivot Min: Bilangan minimum kali harga mesti menyentuh zon untuk dianggap sah.
- Ketelusan Zon: Mengawal kelegapan warna isi (0 = Tidak kelihatan, 255 = Pepejal).
Mengapa LogicLadder?
Perdagangan adalah mengenai kebarangkalian, bukan kepastian. Dengan memvisualisasikan Sokongan dan Rintangan sebagai zon dan bukan garis nipis, SmartTrendScanner membantu anda melihat di mana kecairan sebenar bersembunyi, memastikan anda selangkah lebih maju daripada orang ramai.
Ringkasan
Key features include dynamic cloud zones that cover the full price range to reduce false signals, intelligent pivot detection adjustable by sensitivity, stability filters to avoid outdated levels, and real-time alerts for breakouts or retests. Users can customize settings such as lookback period, pivot strength, minimum touches for zone validation, and cloud transparency to suit various trading styles including scalping, day trading, and swing trading.
Smart Trend Scanner supports multiple markets including Forex, commodities, stocks, and cryptocurrencies, with symbol tags like BTCUSD, EURUSD, GBPUSD, XAUUSD, and NAS100. It aims to provide clearer visualization of liquidity zones to assist traders in making informed decisions based on probabilistic support and resistance areas.