Descrizione
📈 pATR – Percentile Average True Range
Precision Volatility. Smarter Risk. Institutional Edge.
L'indicatore pATR ridefinisce il tradizionale ATR applicando un filtro basato sui percentili ai valori recenti del true range, offrendo ai trader una visione della volatilità fondata su basi statistiche. Invece di affidarsi a medie semplici, pATR calcola il n-esimo percentile dell'intensità del movimento dei prezzi recenti — aiutandoti a identificare con precisione chirurgica le zone di breakout, le configurazioni di fade e le soglie di rischio.
Che tu stia affrontando sfide con prop firm o affinando la tua strategia di scalping, pATR offre un benchmark dinamico della volatilità che si adatta alle condizioni di mercato e mantiene calibrato il tuo rischio.
🔍 Caratteristiche principali
• ATR basato sui percentili: Filtra rumore ed eventi estremi per segnali di volatilità più puliti
• Logica del buffer circolare: Ottimizzato per velocità ed efficienza della memoria — nessun ritardo, nessun ingombro
• Pronto per la modalità Challenge: Ideale per trader di prop firm che gestiscono drawdown e limiti di trade
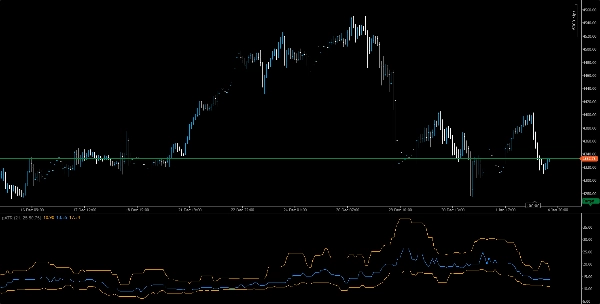
• Visualizzazione pulita: Linea di volatilità arancione con opzioni intuitive di scala e sovrapposizione
• Compatibile con più timeframe: Utilizzabile da M1 a H1 per configurazioni di breakout, fade o trend
🧠 Casi d'uso
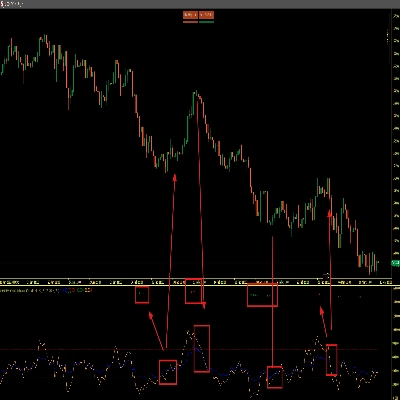
• Conferma del breakout: Usa i picchi di pATR per convalidare le entrate di momentum
• Calibrazione del rischio: Allinea stop-loss e dimensionamento delle posizioni con la volatilità percentilica
• Backtesting della strategia:Convalida le configurazioni con soglie di volatilità coerenti
🎯 A chi è rivolto
• Trader di prop firm in cerca di controllo del rischio basato su regole
• Scalper e strateghi intraday che necessitano di filtri di volatilità adattivi
• Trader quantitativi che integrano la logica percentilica in sistemi personalizzati
• Educatori e mentori che insegnano esecuzione consapevole della volatilità
Riepilogo
Key features include an orange volatility line with intuitive scaling and overlay options, compatibility across multiple timeframes from 1-minute to 1-hour charts, and suitability for prop firm traders managing drawdowns and trade limits. pATR helps traders identify breakout zones, fade setups, and risk thresholds with precision.
Use cases cover breakout confirmation through volatility spikes, risk calibration by aligning stop-loss and position sizing with percentile volatility, and strategy backtesting using consistent volatility benchmarks. The indicator is designed for prop firm traders, scalpers, intraday strategists, quantitative traders integrating percentile logic, and educators focusing on volatility-aware execution.
Supported markets include Forex, stocks, indices, commodities, and cryptocurrencies, making pATR a versatile tool for various trading environments.