

SMC
Indikator
277 muat turun
Versi 1.0, Feb 2026
Windows, Mac
Sejak 01/12/2025
277
Pemasangan percuma
Penerangan
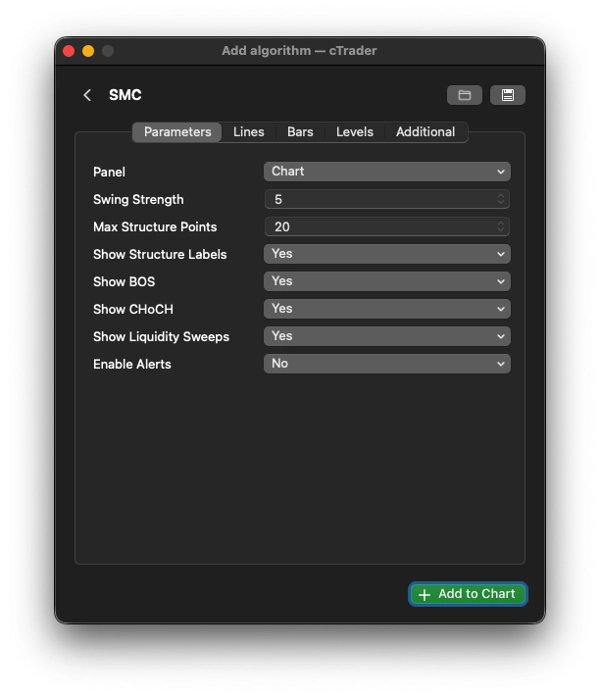
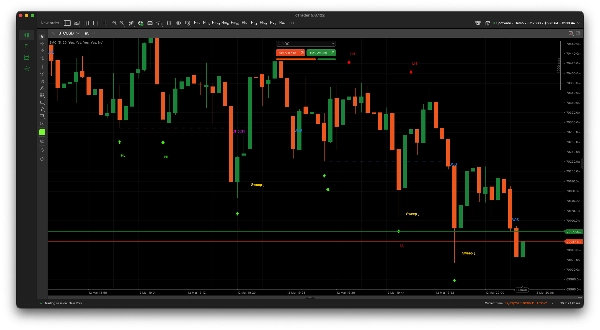
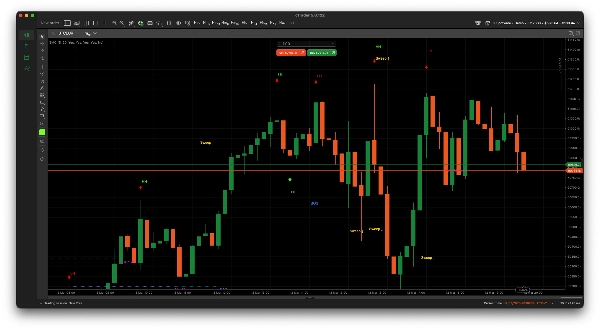
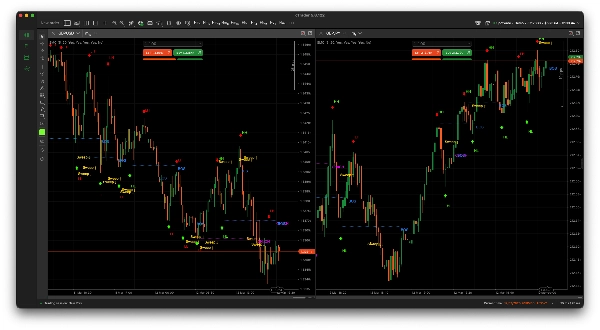
Ringkasan logik teras – bagaimana ia memutuskan apa itu apa
- Mengesan ayunan menggunakan logik fraktal klasik (Bar KekuatanAyunan kiri + kanan)
-
- Default = 5 → ayunan yang agak bersih pada kebanyakan jangka masa
- Menentukan tren daripada dua tinggi terakhir + dua rendah terakhir:
-
- TT + TR → Tren menaik
- RT + RR → Tren menurun
- Pengesanan BOS / CHoCH (pada penutupan):
-
- Penutupan > tinggi ayunan sebelumnya
-
- Jika tren menaik → BOS (sambungan)
- Jika tren menurun → CHoCH (potensi pembalikan)
- Penutupan < rendah ayunan sebelumnya → logik bertentangan
- Sapuan kecairan (corak SMC yang sangat biasa):
-
- Sumbu tinggi di atas tinggi ayunan terakhir tetapi penutupan di bawahnya → sapuan menaik (kemungkinan palsu ke atas)
- Sumbu rendah di bawah rendah ayunan terakhir tetapi penutupan di atasnya → sapuan menurun
Penggunaan dagangan SMC tipikal bagi penunjuk sebegini
- Cari CHoCH + sapuan kecairan dalam arah bertentangan → persediaan pembalikan awal
- Berdagang mengikut arah BOS selepas penarikan balik / sapuan
- Elakkan berdagang bertentangan dengan struktur yang ditunjukkan oleh label TT/TR vs RT/RR
- Ramai pedagang menunggu sapuan → pengesahan CHoCH/BOS urutan pengesahan
Ringkasan
Ringkasan AI
The Dominator SMC Base is a Smart Money Concept (SMC) indicator designed to analyze market structure and identify key trading signals. It detects market swings using classic fractal logic by evaluating swing strength bars on both sides, with a default setting optimized for clean swings across various timeframes. The indicator determines trend direction by comparing the last two highs and lows, classifying trends as bullish (higher highs and higher lows) or bearish (lower highs and lower lows).
It identifies Break of Structure (BOS) and Change of Character (CHoCH) events based on candle closes relative to previous swing highs and lows, signaling potential trend continuations or reversals. The indicator also detects liquidity sweeps, characterized by wicks extending beyond prior swing points but closing within the range, indicating possible fakeouts.
Typical usage involves looking for CHoCH combined with liquidity sweeps for early reversal setups, trading in the direction of BOS after pullbacks or sweeps, and avoiding trades against the established market structure. The indicator supports analysis across multiple markets including Forex, cryptocurrencies, stocks, indices, and commodities, and is applicable on various timeframes. It integrates concepts such as fair value gaps and momentum indicators like RSI to enhance market structure analysis.
It identifies Break of Structure (BOS) and Change of Character (CHoCH) events based on candle closes relative to previous swing highs and lows, signaling potential trend continuations or reversals. The indicator also detects liquidity sweeps, characterized by wicks extending beyond prior swing points but closing within the range, indicating possible fakeouts.
Typical usage involves looking for CHoCH combined with liquidity sweeps for early reversal setups, trading in the direction of BOS after pullbacks or sweeps, and avoiding trades against the established market structure. The indicator supports analysis across multiple markets including Forex, cryptocurrencies, stocks, indices, and commodities, and is applicable on various timeframes. It integrates concepts such as fair value gaps and momentum indicators like RSI to enhance market structure analysis.
Profil indikator
Perbincangan
Ulasan pelanggan
0.0
Ulasan: 0
Ulasan pelanggan
Belum ada ulasan untuk produk ini. Anda sudah mencuba produk tersebut? Jadilah yang pertama untuk berkongsi pendapat anda!
Soalan Lazim
BTCUSD
Forex
Breakout
Indices
EURUSD
Commodities
GBPUSD
NZDUSD
RSI
Prop
ZigZag
Scalping
Fair Value Gap
SMC
Crypto
Stocks
XAUUSD
NAS100
USDJPY
Produk yang tersedia melalui cTrader Store, termasuk bot dagangan, indikator dan plugin, disediakan oleh pembangun pihak ketiga dan diberikan akses untuk tujuan maklumat dan teknikal sahaja. cTrader Store bukan broker dan tidak memberikan nasihat pelaburan, syor peribadi atau sebarang jaminan prestasi masa hadapan.
Lebih banyak produk daripada penulis ini














Harga
Sejak 01/12/2025
277
Pemasangan percuma