
Dominator M4tr1x
Bu, grafik üzerinde akıllı para fiyat yapısı analizini birden çok bilgi paneliyle birleştiren temel bilgilendirici bir araçtır. İşte her ana sistemin bir dökümü:
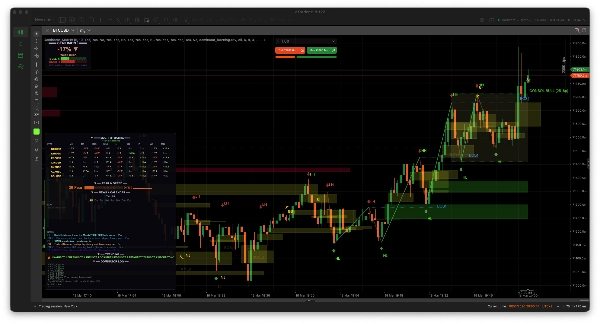
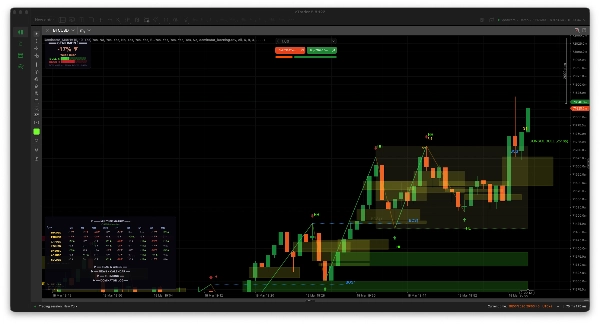
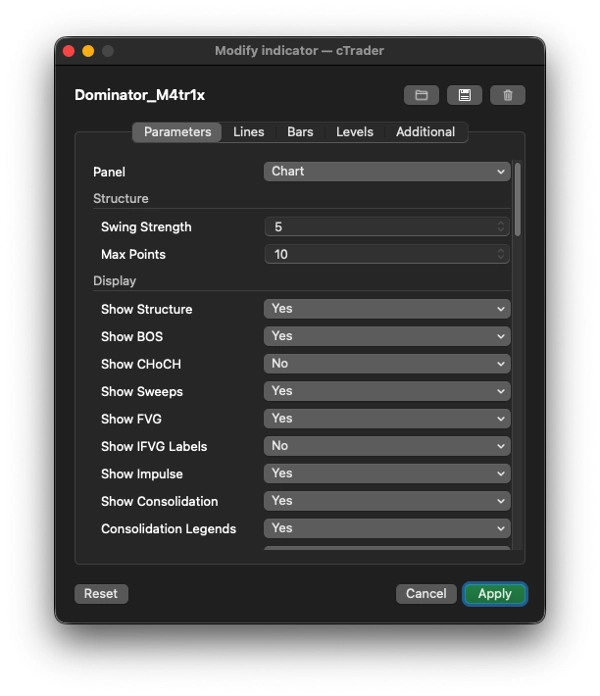
1. 📊 GRAFİK ÜZERİNDE: Akıllı Para Yapısı Analizi
Fiyat grafiği üzerinde doğrudan çizer:
Özellik
Ne yapar ;
Salınım Tespiti
Yapılandırılabilir geri bakış gücü kullanarak salınım yüksek/düşüklerini tanımlar, oklarla işaretler (▲/▼)
Yapı Etiketleri
Her salınımı piyasa yapısını haritalamak için HH (Daha Yüksek Yüksek), HL (Daha Yüksek Düşük), LH (Daha Düşük Yüksek), LL (Daha Düşük Düşük) olarak etiketler
BOS (Yapı Kırılması)
Fiyat önceki salınım yüksek/düşüğünü kırdığında noktalı çizgiler + etiketler çizer trend yönünde
CHoCH (Karakter Değişimi)
BOS ile aynı ancak trende karşı — potansiyel bir trend dönüşünü işaret eder
Kırılma Geçersizliği
Fiyat BOS/CHoCH seviyesinden geri dönerse, bunu başarısız (✗ ile gri renkte) olarak işaretler ve kaydeder
Likidite Süpürmeleri
Fiyatın bir salınım yüksek seviyesinin üzerine (veya düşük seviyesinin altına) fitil attığını ancak tekrar içine kapandığını algılar — klasik bir likidite yakalama paterni
FVG (Adil Değer Boşlukları)
3-mumluk dengesizlikleri tespit eder (mum 1'in yüksek seviyesi ile mum 3'ün düşük seviyesi arasındaki boşluklar). Grafikte renkli dikdörtgenler çizer
IFVG (Ters FVG)
Fiyat bir FVG'yi doldurmak için geri döndüğünde, bunu "IFVG" olarak etiketler (boşluk potansiyel destek/direnç bölgesi olur)
FVG Geçersizliği
Fiyat bir FVG bölgesini kararlı şekilde kapatırsa, geçersiz olarak işaretlenir
İmpuls Dalgaları
Salınım noktalarını trend çizgileriyle bağlar — yeşil impuls bacaklar (trend ile), sarı düzeltici bacaklar için
Konsolidasyon Bölgeleri
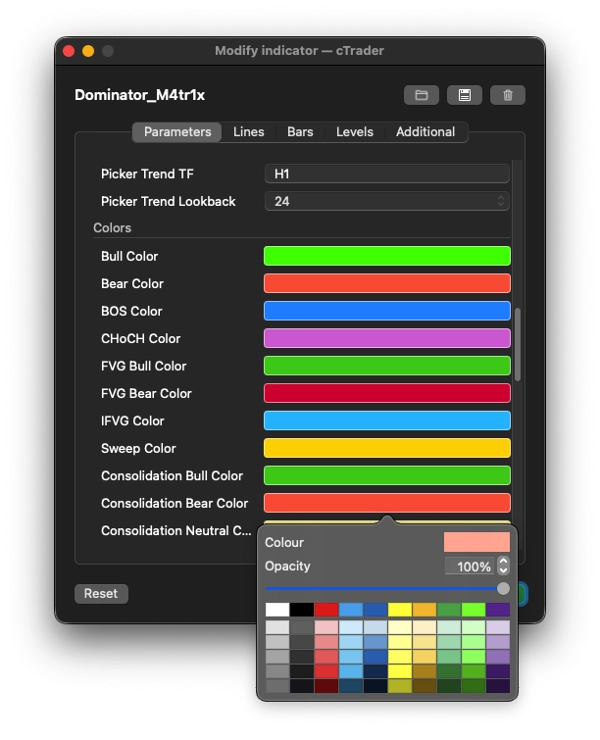
Ardışık salınım yüksek ve düşüklerinin dar bir ATR tabanlı aralıkta olduğunu tespit eder, yön eğilimini ve pip genişliğini gösteren "CONSOL BULL/BEAR/NEUTRAL" etiketiyle bir kutu çizer
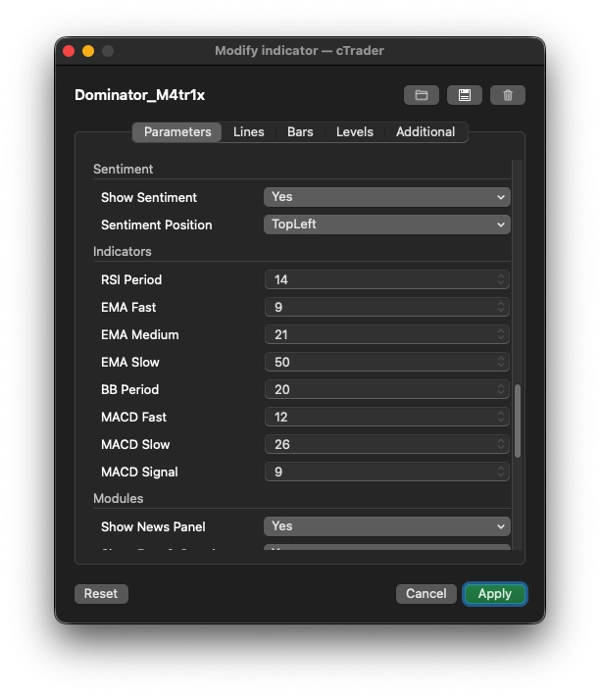
2. 📈 DUYGU PANELİ (varsayılan olarak sol üstte)
Mevcut grafik sembolü/zaman dilimi için gerçek zamanlı boğa/ayı puanlama göstergesi kullanarak:
- RSI (aşırı satım/aşırı alım + uyumsuzluk tespiti)
- MACD (kesişmeler, histogram momentumu)
- 3 EMA (hızlı/orta/yavaş hizalama ve fiyat konumu)
- Bollinger Bantları (fiyat üst/alt bant uçlarında)
Gösterir:
- -100%'den +100%'e kadar bir yüzde puanı (örneğin, "+67% GÜÇLÜ BOĞA")
- Görsel boğa vs. ayı puan çubukları (█████░░░░)
- Çalışan sinyal istatistikleri (toplam sinyaller, onaylananlar, geçersizler, doğruluk %)
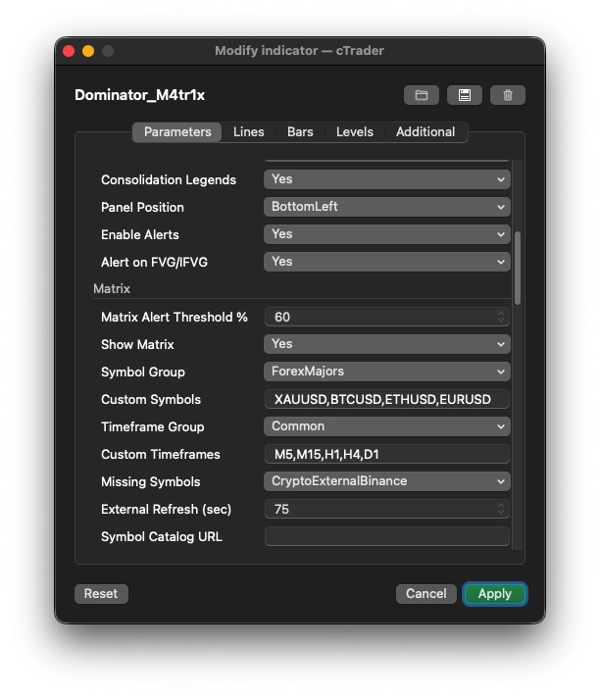
3. 🔢 ÇOKLU ZAMAN DİLİMİ MATRİSİ (ana panel)
Bir ızgara/ısı haritası, aynı anda birden çok sembol × birden çok zaman dilimi için boğa/ayı duygu puanlarını gösterir.
Özellik
Detaylar
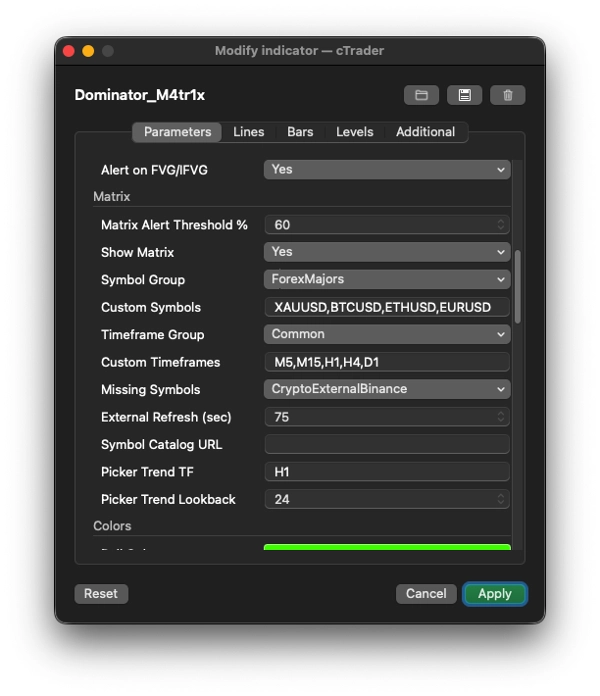
Sembol grupları
Forex Majör/Minör/Exotic, Kripto, Endeksler, ABD Hisseleri, Metaller, Enerji, Emtialar veya Özel
Zaman dilimi grupları
Ortak (M5–W1), Tümü veya Özel
Her hücre
Aynı RSI/MACD/EMA/BB puanlama motorunu kullanarak "+42▲" (yeşil) veya "-67▼" (kırmızı) gibi renk kodlu bir puan gösterir
Sembol çözünürlüğü
Son derece sağlam — broker adlandırma kurallarını otomatik algılar (.r, m, .cash gibi ekler, EUR/USD gibi eğik çizgiler), onlarca takma ad varyasyonunu dener, sonuçları önbelleğe alır
Harici veri
Broker'ın taşımadığı semboller için (özellikle kripto), Binance, Bybit, OKX, Kraken, Bitfinex API'lerinden OHLC verisi çeker (ücretsiz, anahtar gerekmez)
Premium API'ler
İsteğe bağlı olarak TwelveData, AlphaVantage, Polygon, Stooq API anahtarlarıyla hisse senetleri/endeksler/forex için destekler
Etkileşimli
Herhangi bir sembol adına tıklayın → 100+ sembolü tüm kategorilerde gösteren aranabilir sembol seçici açılır, 24 saatlik % değişimi gösterir. Herhangi bir zaman dilimi başlığına tıklayın → sütunları değiştirmek için zaman dilimi seçici açılır
Uyarılar
Herhangi bir hücre yapılandırılabilir eşik değerini aşarsa (örneğin, ±%60), uyarı sesi çalar
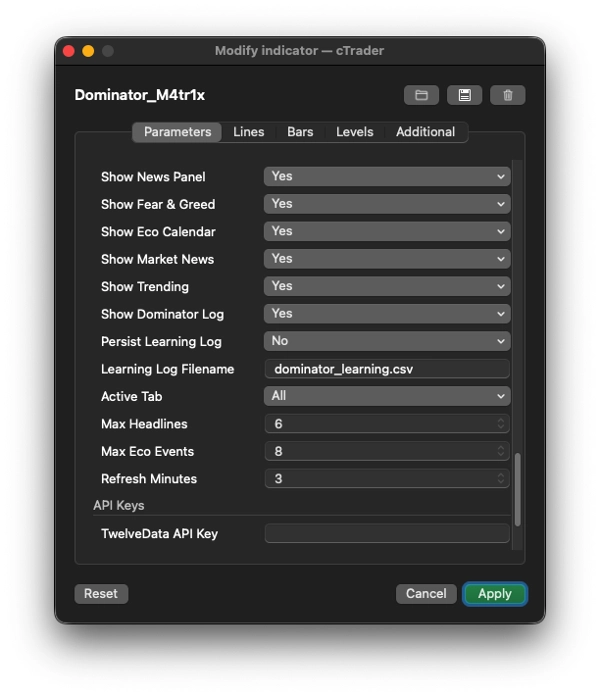
4. 📰 HABER + BİLGİ PANELLERİ
Ekonomik Takvim
Yaklaşan yüksek/orta etkili ekonomik olayları 8+ yedekli kaynaktan toplar:
- ForexFactory (JSON + XML), TradingView, Finnhub, TradingEconomics, MQL5, FXStreet, FMP (FinancialModelingPrep)
- Acil durumlara göre renk kodlu (kırmızı = ŞİMDİ, turuncu = <15 dk, sarı = <1 saat, yeşil = sonra)
Piyasa Haber Başlıkları
12+ RSS/API kaynağından toplar:
- Kripto: CryptoCompare, CoinDesk, CoinTelegraph, NewsBTC, Binance duyuruları, OKX sistem durumu
- Forex: FXStreet, ForexLive
- Endeksler/Hisseler: MarketWatch, CNBC, Reuters, Yahoo Finance
- Anahtar kelime tespiti ile başlıkları otomatik kategorize eder (kripto/forex/metaller/enerji/hisseler)
- Sekmeye göre filtrelenebilir (Tümü, Forex, Kripto, Metaller, Endeksler, Hisseler, Enerji, Ekonomik)
Korku & Açgözlülük Endeksi
- Kripto Korku & Açgözlülük Endeksi (alternative.me API, CNN Business yedekli)
- Sayısal değer (0–100), etiket (Aşırı Korku → Aşırı Açgözlülük), renk çubuğu ve 7 günlük sparkline geçmişi (▁▂▃▄▅▆▇█)
Trend Olanlar
- Binance 24 saatlik ticker'dan en iyi kripto hareketlendiricileri çeker (en çok kazanan ilk 5 + en çok kaybeden ilk 5)
- CoinGecko trending veya CoinPaprika'ya geri döner
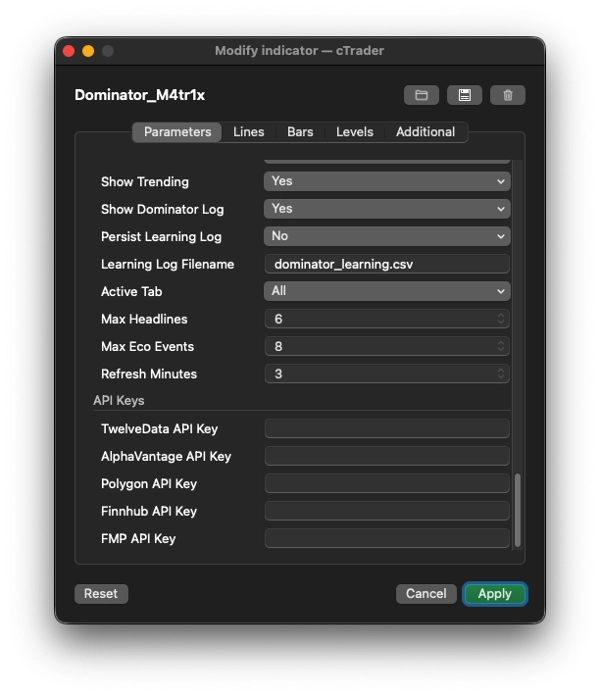
5. 📝 DOMINATOR KAYDI + ÖĞRENME SİSTEMİ
- Son 8 sinyali durumlarıyla gösteren sinyal kaydı tutar (● aktif, ✓ onaylandı, ✗ geçersiz)
- Genel doğruluk istatistiklerini takip eder (toplam sinyaller, onaylanan işlemler, geçersizler, doğruluk %)
- İsteğe bağlı CSV kalıcılığı: her sinyal olayını (yeni/onay/geçersiz) tam meta verilerle bir CSV dosyasına yazar (
dominator_learning.csv) — gelecekteki makine öğrenimi veya geriye dönük test için tasarlanmıştır
6. 🛠 Teknik Mimari Öne Çıkanlar
- Tam örtüşme (
IsOverlay = true) — fiyat grafiği üzerinde çizer, ayrı bir panel değil - AccessRights = None — broker'ın sandbox'ında çalışır (cAlgo'nun izin verdiği dışında dosya sistemi/ağ erişimi yok)
- Asenkron veri çekme — tüm HTTP çağrıları arka plan iş parçacıklarında
Task.Run()ile çalışır, grafik asla bloke olmaz - Akıllı önbellekleme — sembol çözünürlüğü, harici OHLC verisi, ticker fiyatları ve trend yüzdeleri yapılandırılabilir yenileme aralıklarıyla önbelleğe alınır
- Otomatik yeniden deneme — başarısız sembol çözünürlükleri ve harici veri çekimleri her 45 saniyede bir yeniden denenir
- Katlanabilir bölümler — her panel bölümü (Matris, Korku & Açgözlülük, Haberler, Trendler, Kayıt) başlığına tıklanarak daraltılıp genişletilebilir
Özetle
Dominator M4tr1x, tüm bir ticaret panosunun yerini alan Bilgilendirici bir göstergedir. Grafik üzerinde akıllı para yapısını haritalar (BOS, CHoCH, FVG'ler, süpürmeler, konsolidasyon), teknik göstergelerle çoklu varlık/çoklu zaman dilimi duygu puanları verir, 20+ kaynaktan ekonomik takvimler ve piyasa haberlerini toplar, Korku & Açgözlülüğü takip eder, trenddeki varlıkları gösterir, tüm kendi sinyallerini doğruluk takibi ile kaydeder ve sembolleri ile zaman dilimlerini etkileşimli olarak değiştirmenize izin verir — tüm bunları arka planda 5+ harici borsa API'sinden eksik verileri çekerek yapar.
5 | 0 % | |
4 | 100 % | |
3 | 0 % | |
2 | 0 % | |
1 | 0 % |


