
MM-HTF Bars
지표
1 구매
버전 1.0, Apr 2025
Windows, Mac
5.0
리뷰: 1
설명
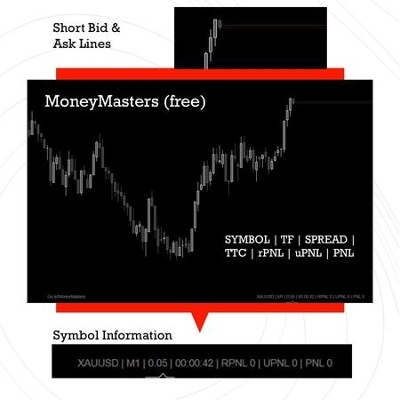
MoneyMasters - HTF Bars Indicator
강력한 도구인 MM-HTF Bars Indicator로 거래 경험을 향상하세요. 이 도구는 cTrader용으로 설계되어 현재 차트 위에 상위 시간대(HTF) 캔들스틱 데이터를 원활하게 오버레이합니다. 이 지표는 HTF 가격 움직임을 명확하게 시각화하여 여러 시간대를 한 화면에서 결합해 더 정보에 기반한 거래 결정을 내릴 수 있도록 도와줍니다.
주요 기능:
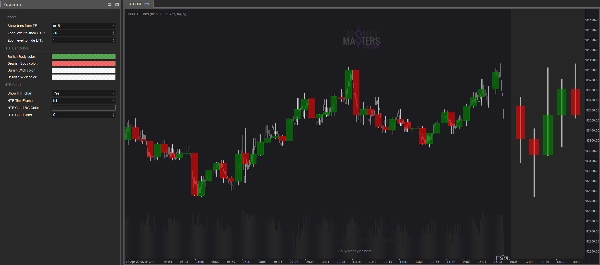
- 사용자 지정 가능한 시간대: 차트에 직접 표시할 상위 시간대(예: 15분, 1시간)를 선택하세요.
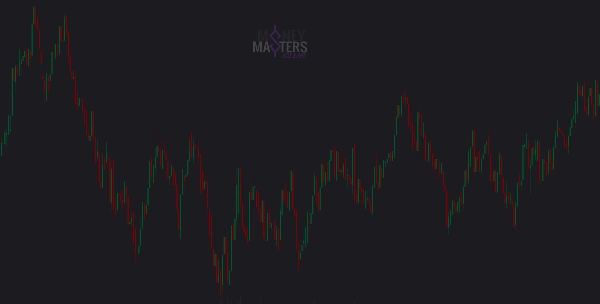
- 동적 줌 제어: 차트의 줌 레벨에 따라 HTF 및 하위 시간대(LTF) 바를 자동으로 숨기거나 표시하여 깔끔한 환경을 제공합니다.
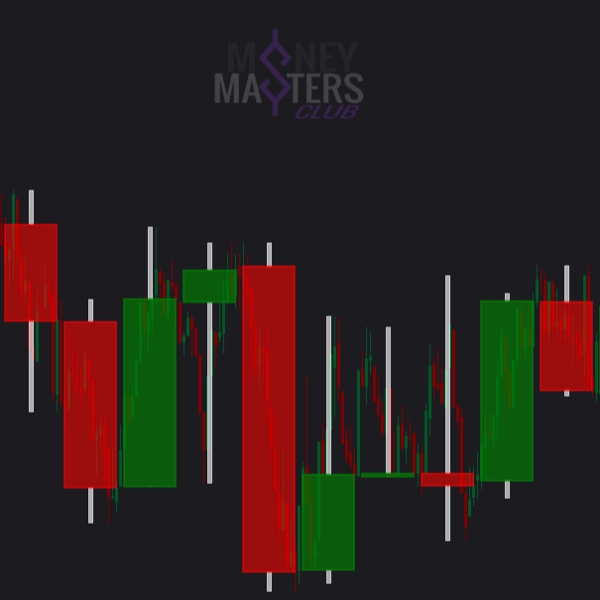
- 색상 구분 캔들스틱: 사용자 지정 가능한 몸통 및 심지 색상으로 강세 및 약세 HTF 캔들을 쉽게 구분할 수 있습니다.
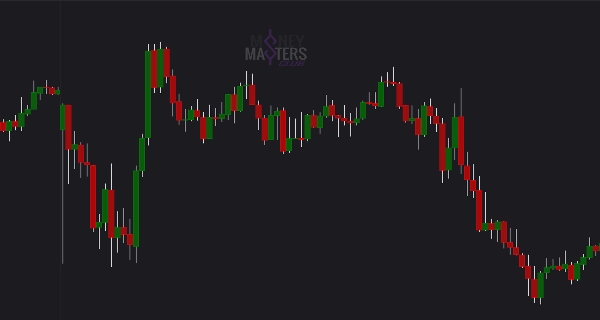
- 정확한 시각화: 차트 타임라인에 정확히 맞춰 HTF 시가, 고가, 저가, 종가 수준을 표시합니다.
- 원활한 통합: 오버레이로 작동하여 차트를 깔끔하고 읽기 쉽게 유지합니다.
혜택:
- HTF 가격 움직임과 LTF 데이터를 함께 분석하여 시장 동향에 대한 더 깊은 이해를 얻으세요.
- 핵심 HTF 지지 및 저항 수준을 식별하여 거래 전략을 개선하세요.
- 여러 차트 간 전환할 필요 없이 시간과 노력을 절약하세요.
스캘퍼, 데이 트레이더, 스윙 트레이더 등 누구든지 MM-HTF Bars Indicator 는 시장 분석과 의사 결정 과정을 향상시키는 필수 도구입니다.
오늘부터 더 스마트하게 거래를 시작하세요!
----------
업데이트 1.02 / 25041201:
- HTF 미니 차트 - 이제 오른쪽에 HTF 캔들이 표시된 미니 차트를 보여줍니다. 다른 시간대와 표시할 캔들 수를 선택할 수 있습니다.
----------
업데이트 1.01 / 25040901:
- 더 부드러운 작동 - 이제 지표가 틱이 아닌 줌 변경 시 업데이트됩니다.
- 지표가 Market Reply 일시정지 중에도 캔들을 변경할 수 있습니다.
요약
AI 요약
The MM-HTF Bars Indicator for cTrader overlays higher timeframe (HTF) candlestick data onto your current chart, enabling multi-timeframe analysis within a single view. Users can customize the displayed higher timeframe (e.g., 15 minutes, 1 hour) and benefit from dynamic zoom control that automatically shows or hides HTF and lower timeframe (LTF) bars based on the chart’s zoom level. The indicator features color-coded candlesticks for easy identification of bullish and bearish HTF candles, with customizable body and wick colors. It precisely visualizes HTF open, high, low, and close prices aligned accurately to the chart’s timeline. Designed as an overlay, it integrates seamlessly without cluttering the chart. Additional functionality includes a mini HTF chart displayed on the right side, with adjustable timeframe and candle count. Updates improve performance by refreshing on zoom changes rather than every tick and allow candle changes during market pauses. This tool supports traders across styles—scalping, day trading, and swing trading—by enhancing market trend analysis, identifying key HTF support and resistance levels, and reducing the need to switch between multiple charts.
지표 프로필
고객 리뷰
5.0
리뷰: 1
5 | 100 % | |
4 | 0 % | |
3 | 0 % | |
2 | 0 % | |
1 | 0 % |
고객 리뷰
상담
자주 묻는 질문(FAQ)
Prop
Scalping
트레이딩 봇, 지표, 플러그인 등 cTrader Store에서 제공되는 상품은 제3자 개발자에 의해 제공되며, 이는 단순히 정보 및 기술적 접근을 목적으로 제공된 것입니다. cTrader Store는 중개인이 아니며, 투자 조언, 개인별 추천 또는 향후 성과에 대한 어떠한 보장도 제공하지 않습니다.
이 작성자의 상품 더 보기


가격
가입일 17/10/2024
54.3M
거래량
380.03K
핍 수익
2
판매
335
무료 설치