
설명
쇼케이스:
슈퍼트렌드 지표 – 시장 추세를 쉽게 따라가고 더 스마트한 투자 결정을 내릴 수 있게 해주는 트레이더를 위한 필수 도구입니다! 이 직관적이고 전문적인 지표는 초보자든 경험 많은 투자자든 명확한 매수 및 매도 신호를 제공하도록 설계되었습니다.
왜 슈퍼트렌드 지표를 선택해야 할까요?
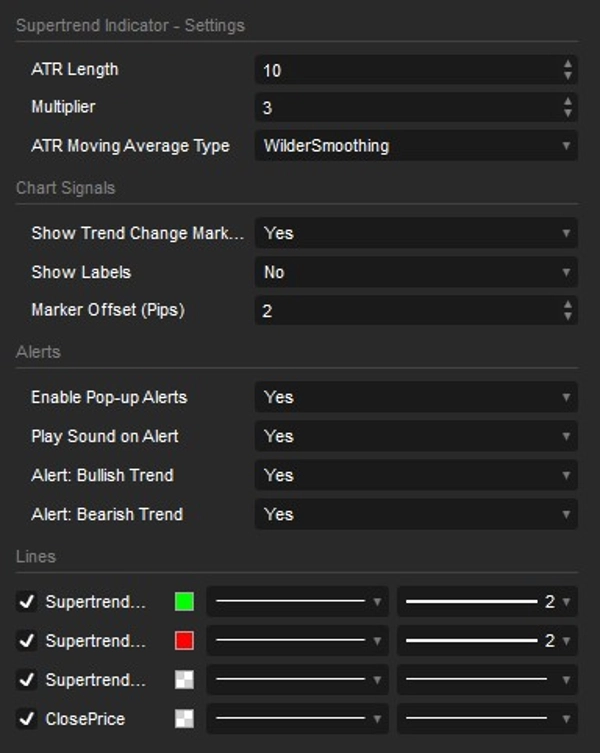
- 업계 표준 정확도: Wilder의 스무딩을 포함한 맞춤형 ATR 이동평균 유형을 새롭게 제공합니다. TradingView와 같은 주요 차트 플랫폼에서 인기 있는 프리미엄 슈퍼트렌드 버전과 동일하게 계산하고 반응합니다!
- 100% 리페인팅 없음: 견고한 추세 기억 메커니즘으로 구축되었습니다. 추세가 바뀌고 신호가 출력되면 그대로 유지됩니다. 리페인팅, 사라지는 화살표, 차트 기록을 스크롤할 때 재계산 오류가 없습니다.
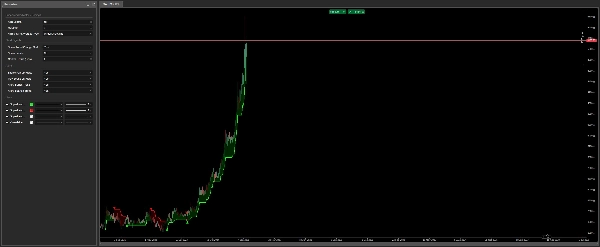
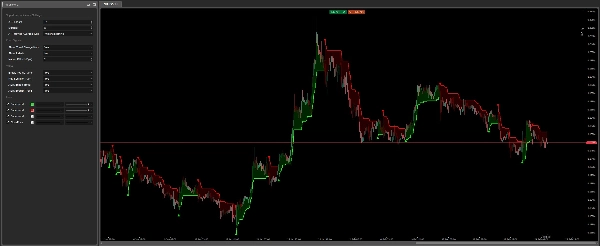
- 단순함과 효과성: 지표는 시장이 상승할 때(매수 신호) 초록색으로, 하락할 때(매도 신호) 빨간색으로 변하는 슈퍼트렌드 라인을 자동으로 그립니다. 항상 추세 방향을 정확히 알 수 있습니다.
- 스마트 실시간 알림: 거래 기회를 절대 놓치지 마세요! 이 지표는 네이티브 cTrader 팝업과 통합된 사운드 효과를 활용한 업그레이드된 알림 시스템을 갖추고 있습니다. 또한 내장된 스팸 방지 기능으로 실시간 신호가 발생할 때 한 번만 알림을 받으며, 차트를 로드하거나 다시 로드할 때 불필요한 소리 스팸이 없습니다.
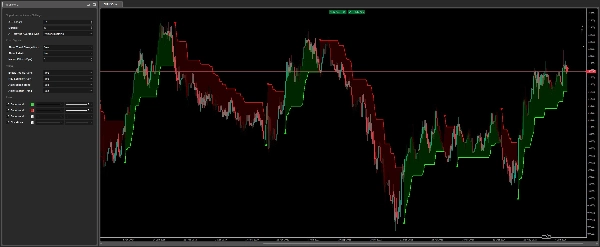
- 향상된 시각 신호 및 클라우드 채우기: 중요한 추세 변화마다 눈에 띄는 화살표와 선택적 "강세"/"약세" 텍스트 레이블을 볼 수 있습니다. 슈퍼트렌드 라인과 가격 사이의 미묘하고 역동적인 클라우드 채우기는 시장 모멘텀을 한눈에 쉽게 파악할 수 있게 도와줍니다.
- 완전한 사용자 정의 및 정밀성: ATR 길이와 배수와 같은 핵심 설정을 쉽게 조정할 수 있습니다. 또한 동적 핍 기반 오프셋을 사용하여 화살표와 레이블의 거리를 정확하게 제어할 수 있어 어떤 자산에서도 완벽하고 깔끔한 시각 효과를 보장합니다.
슈퍼트렌드 지표는 시장 분석을 단순화하려는 모든 사람에게 완벽합니다 – 추세를 쉽게 파악하려는 초보 트레이더부터 전략에 매우 정밀하고 리페인팅 없는 신호를 원하는 숙련된 전문가까지. 외환, 주식, 지수, 암호화폐 등 모든 시장과 모든 시간대에서 완벽하게 작동합니다.
요약
AI 요약
The Supertrend Indicator v1.1 is a professional-grade trading tool designed to identify market trends and provide clear buy and sell signals. It features customizable ATR moving average types, including Wilder's smoothing, ensuring accuracy comparable to leading platforms. The indicator is 100% non-repainting, maintaining stable signals without recalculation errors or disappearing markers. It visually represents trends with a line that turns green during upward movements and red during downward trends, complemented by arrows, optional "Bullish"/"Bearish" labels, and a dynamic cloud fill to highlight market momentum. Real-time alerts use native cTrader pop-ups and sound effects with built-in spam protection, notifying users once per signal. Users can adjust key parameters such as ATR length, multiplier, and visual offsets for precise, uncluttered display across all asset types. The Supertrend Indicator supports multiple markets including Forex, Stocks, Indices, and Cryptocurrencies, and is suitable for all timeframes. It is designed for traders of all experience levels seeking a reliable, easy-to-interpret trend analysis tool.
지표 프로필
고객 리뷰
4.3
리뷰: 3
5 | 33 % | |
4 | 67 % | |
3 | 0 % | |
2 | 0 % | |
1 | 0 % |
고객 리뷰
November 4, 2025
Smooth and steady - Supertrend v1.1 keeps you riding the trend with confidence. Clear color switches show when momentum flips, helping you enter early and exit smart. Fast, reliable, and a classic trend tool that belongs in every trader’s arsenal. Pairs perfectly with momentum filters or ATR-based setups for precision entries!
August 6, 2025
상담
자주 묻는 질문(FAQ)
Signal
Indices
Commodities
GBPUSD
RSI
Bollinger
Fibonacci
Scalping
AI
XAUUSD
NAS100
MACD
BTCUSD
Forex
Breakout
EURUSD
NZDUSD
Martingale
Prop
ZigZag
Supertrend
Fair Value Gap
SMC
Crypto
Grid
Stocks
ATR
USDJPY
VWAP
트레이딩 봇, 지표, 플러그인 등 cTrader Store에서 제공되는 상품은 제3자 개발자에 의해 제공되며, 이는 단순히 정보 및 기술적 접근을 목적으로 제공된 것입니다. cTrader Store는 중개인이 아니며, 투자 조언, 개인별 추천 또는 향후 성과에 대한 어떠한 보장도 제공하지 않습니다.


좋아하실 만한 다른 항목


가격
89
판매
149
무료 설치