MACD Indicator
지표
버전 1.0, Jun 2026
Windows, Mac
Trading product for MACD Indicator 지표 EMA SMA, image 2
Trading product for MACD Indicator 지표 EMA SMA, image 3
Trading product for MACD Indicator 지표 EMA SMA, image 4
Trading product for MACD Indicator 지표 EMA SMA, image 5
Trading product for MACD Indicator 지표 EMA SMA, image 6
87
판매
147
무료 설치

설명

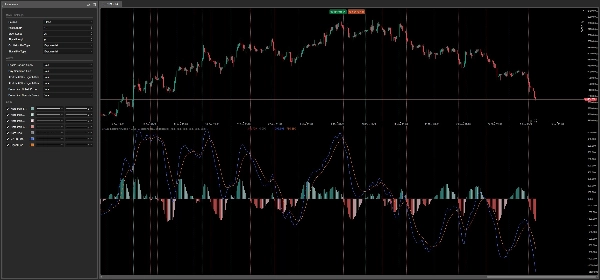
쇼케이스:


MACD 지표는 cTrader 플랫폼용 고전적인 이동평균 수렴 확산 지수(MACD) 오실레이터의 정제되고 시각적으로 향상된 버전입니다. TradingView 원본의 동작과 외관을 그대로 반영하도록 제작되어, 친숙하고 전문적인 경험을 여러 스마트 업그레이드와 함께 제공합니다.


왜 MACD 지표를 선택해야 하나요?

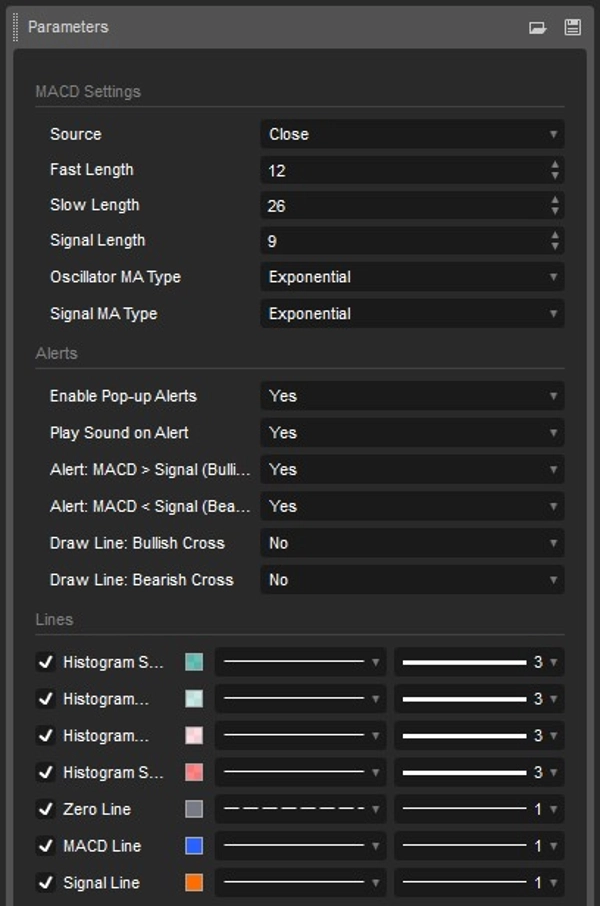
1. 100% TradingView 호환성

핵심 알고리즘은 TradingView의 표준 MACD와 정확히 동일한 논리를 따릅니다. MACD 라인은 빠른 이동평균과 느린 이동평균의 차이로 계산되고, 신호선은 세 번째 이동평균에서 도출되며, 히스토그램은 두 값의 차이로 표시됩니다. 결과적으로 이미 알고 있는 차트와 픽셀 단위로 완벽하게 일치합니다.

2. 지능형 4색 히스토그램

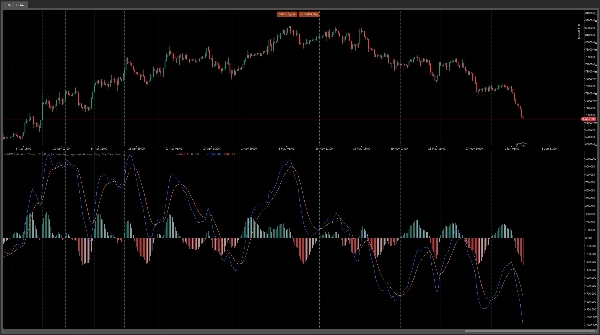
단순한 2톤 히스토그램 대신, 이 지표는 TradingView의 PineScript 구현과 동일한 동적 4색 그라데이션 시스템을 사용합니다:

- 강한 양성 – 히스토그램 막대가 0 이상이고 상승 중

- 약한 양성 – 히스토그램 막대가 0 이상이지만 하락 중

- 약한 음성 – 히스토그램 막대가 0 이하이지만 상승 중

- 강한 음성 – 히스토그램 막대가 0 이하이고 하락 중

이 색상 지능 덕분에 원시 숫자를 해석할 필요 없이 모멘텀이 가속화되는지 약화되는지를 즉시 평가할 수 있습니다.

3. 팝업 및 사운드*가 포함된 내장 알림 시스템

화면에서 떨어져 있어도 정보를 받을 수 있습니다. 이 지표는 다음과 같은 경우 네이티브 cTrader 팝업 알림을 보내고 구별되는 소리를 재생할 수 있습니다:

- MACD 라인이 신호선을 상향 돌파할 때 (강세 교차 – 매수 신호)

- MACD 라인이 신호선을 하향 돌파할 때 (약세 교차 – 매도 신호)

각 알림 유형은 독립적으로 켜고 끌 수 있으며, 동일한 바에서 중복 알림이 발생하지 않도록 시스템이 보호됩니다.

4. 사용자 정의 가능한 시각적 신호

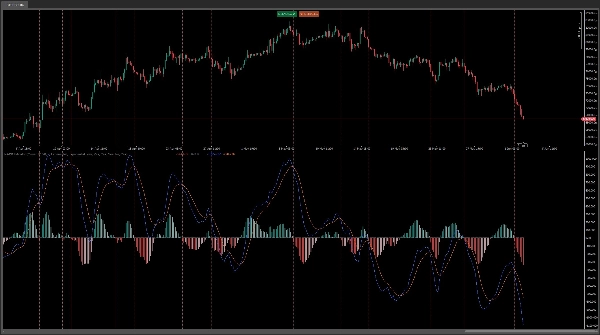
강세 또는 약세 교차가 발생할 때마다 차트에 점선 수직선을 선택적으로 그릴 수 있습니다. 이를 통해 데이터를 수동으로 스크롤하지 않고도 과거 신호 구역을 한눈에 쉽게 확인할 수 있습니다.

5. 완전 사용자 정의 가능 및 유연성

거래 스타일에 맞게 지표의 모든 측면을 세밀하게 조정할 수 있습니다:

- 빠른 길이 – 빠른 이동평균 기간

- 느린 길이 – 느린 이동평균 기간

- 신호 길이 – 신호선 이동평균 기간

- 오실레이터 MA 유형 – MACD 계산을 위한 모든 이동평균 유형(EMA, SMA 등) 중 선택

- 신호 MA 유형 – 신호선에 대한 MA 유형을 독립적으로 선택


이 지표는 누구를 위한 것인가요?

TradingView 파워 유저로서 원본과 정확히 동일하게 동작하고 계산하며 색상을 표현하는 cTrader 네이티브 MACD를 원하는 분들 – 놀라움이나 불일치 없이.

실시간 교차 알림과 팝업 알림 및 사운드를 모두 갖춘 명확한 신호를 찾는 재량 거래자들로, 하루 종일 화면을 응시하지 않고도 진입을 쉽게 포착할 수 있습니다.

모멘텀 진단 도구로서 4색 히스토그램을 높이 평가하는 분석적 거래자들 – 강세 또는 약세 압력이 강해지거나 약해지는지를 빠르게 식별할 수 있습니다.

모든 경험 수준 – MACD는 기본적인 오실레이터이며, 이 구현은 깔끔한 시각, 스마트 색상 코딩, 완전 구성 가능한 알림 시스템으로 그 어느 때보다 접근성을 높였습니다.


cGuru

요약

AI 요약
The MACD Indicator for cTrader is a precise implementation of the classic Moving Average Convergence Divergence oscillator, designed to replicate TradingView’s original behavior and appearance. It calculates the MACD line as the difference between fast and slow moving averages, derives a signal line from a third moving average, and displays a histogram representing their difference. The histogram uses a four-color gradient to indicate momentum strength and direction: strong positive, weak positive, weak negative, and strong negative, enabling quick visual assessment of momentum changes.
This indicator includes a built-in alert system with customizable pop-up and sound notifications for bullish and bearish MACD-signal line crossovers, with options to toggle alerts independently and prevent duplicates. Users can also enable vertical dotted lines on the chart to mark crossover events for easier historical analysis.
All parameters are fully customizable, including the periods for fast, slow, and signal moving averages, as well as the types of moving averages used (EMA, SMA, etc.). The indicator supports signals for crossovers and trend strength, and requires bar or tick data input. It is suitable for traders seeking a TradingView-compatible MACD with enhanced visual cues and real-time alerts on the cTrader platform.

지표 프로필
지표 카테고리
추세
출력 유형
신호
필터
시각화
데이터 요구 사항
막대만
틱 데이터
지원되는 신호
크로스
추세 강도

고객 리뷰

0.0
리뷰: 0
고객 리뷰
이 상품에 대한 리뷰가 아직 없습니다. 이미 사용해 보셨나요? 다른 사람들에게 가장 먼저 소개해 주세요!

상담

자주 묻는 질문(FAQ)

EMA
SMA
Key Levels
MACD
Moving Average
트레이딩 봇, 지표, 플러그인 등 cTrader Store에서 제공되는 상품은 제3자 개발자에 의해 제공되며, 이는 단순히 정보 및 기술적 접근을 목적으로 제공된 것입니다. cTrader Store는 중개인이 아니며, 투자 조언, 개인별 추천 또는 향후 성과에 대한 어떠한 보장도 제공하지 않습니다.

이 작성자의 상품 더 보기

지표
AI
ATR
+27
Trend Is Your Friend cBot - INDICATOR - Professional Grid, Pyramid, Swing & Scalp Trading Indicator
지표
AI
ATR
+27
Supertrend Indicator
지표
AI
ATR
+27
Nadaraya-Watson Envelope Indicator
지표
AI
ATR
+27
Market Cipher B
지표
AI
ATR
+27
Supertrend Indicator
지표
AI
ATR
+26
MacD Custom Indicator-Multiple Time Frame
지표
AI
ATR
+19
Market Cipher A
cBot
AI
ATR
+27
RSI Simple Grid cBot - grid trading strategy with RSI (Relative Strength Index) signals
26.8%
ROI
4.41
손익비
cBot
AI
ATR
+27
SmartHedge cBot - Your Trading Companion
1.26
손익비
cBot
ATR
RSI
+5
Trend is your friend cBot - Professional Grid, Pyramid, Swing & Scalp Trading System
28%
ROI
5.27
손익비
지표
RSI
SMA
+1
TradingView RSI replica for cTrader with dynamic gradients, automatic divergence detection, and alerts.

좋아하실 만한 다른 항목

지표
VWAP
Forex
+13
Custom VWAP Indicator for cTrader
지표
AI
ATR
+26
SMC without the mess: Clean structure + auto-managing FVGs + MTF panel. Hard-right-edge, step size-based for any symbol.
지표
Prop
Forex
+9
Average Cost Price helps you keep track of your open positions on the chart. In doing so, it provides lines and explanat
지표
MACD
Prop
+14
Customize the MACD! Choose colors, get real-time tick updates, and see crossover points for enhanced trading precision.
지표
RSI
Signal
+1
🚀📈 Plot buy/sell signals on Range Bars using Moving Averages and RSI. Clear, actionable trading insights.🚀📈
지표
Aggressive
Supertrend
+5
Stop trading with tunnel vision! 🚫 The Heat Map Dashboard is an institutional-grade visual trading assistant
지표
ATR
BOS
+3
Fair Value Gaps with Multi-Timeframe.
지표
MACD
Prop
+8
NTNPICLL is a tool to check the best trading hours for the assets and also includes the highest and lowest point
지표
Forex
BTCUSD
+10
Trend-following channel using dual MAs with visual cloud and optional alerts on crossovers
지표
Forex
BTCUSD
+11
Visualize trends with Standard Deviation Channel! Display median, and add customizable upper/lower deviation channels.
지표
VWAP
Volume
+3
Don't trust static support and resistance levels, this indicator combines Fibonacci and VWAP in one powerful tool.
지표
Forex
cTrader ZigZag Alerts: Precision Swing Detection, Alerts, and Fibonacci.
지표
ATR
Engulfing
+5
This indicator maps D1, H4, H1 and 15M Multi-Timeframe Bias and Fresh High Probability Supply and Demand zones
지표
Forex
Crypto
+3
Detect powerful 2-candle reversal patterns at key highs/lows. Boost entries with real-time alerts and visual signals.
지표
AI
SMC
+7
The ultimate tool for Price Action and ICT. High, Low and Mid levels for days, weeks Inc. NY Midnight and Custom Range.
지표
AI-assisted
Order Block
+5
The daily bias estimator indicator uses ICT concepts to show whether the chart is bullish or bearish on multi-time frame
지표
MultiTF Pivot and SR Indicator
지표
BOS
MSS
+3
Orderblocks with Multi-Timeframe.

가격

87
판매
147
무료 설치