
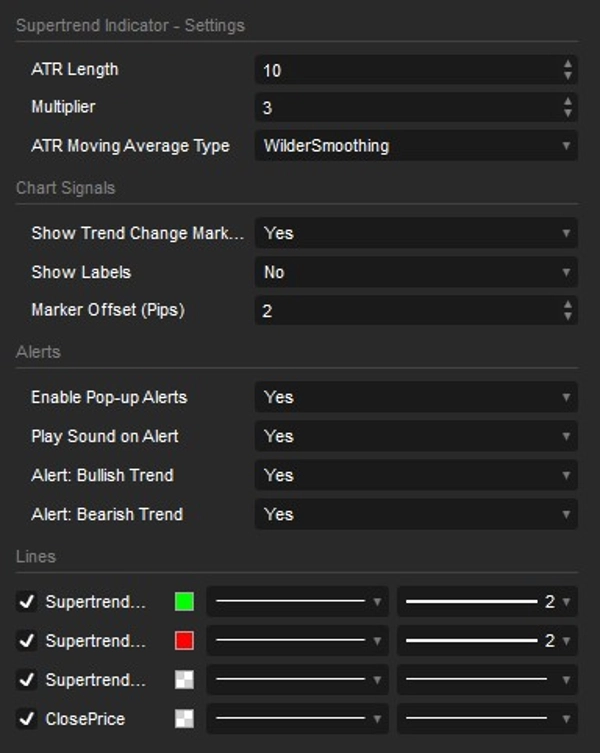
Beschreibung
Showcase:
Supertrend-Indikator – ein unverzichtbares Werkzeug für Trader, das es einfach macht, Marktentwicklungen zu nutzen und klügere Investitionsentscheidungen zu treffen! Dieser intuitive, professionelle Indikator ist darauf ausgelegt, kristallklare Kauf- und Verkaufssignale zu liefern, egal ob Sie gerade erst anfangen oder ein erfahrener Investor sind.
Warum den Supertrend-Indikator wählen?
- Branchenübliche Genauigkeit: Jetzt mit anpassbaren ATR-Gleitenden-Durchschnittstypen (einschließlich Wilders Glättung). Er berechnet und reagiert genau wie die beliebtesten Premium-Supertrend-Versionen, die auf führenden Charting-Plattformen wie TradingView zu finden sind!
- 100 % Nicht-Neuzeichnung: Entwickelt mit einem robusten Trendgedächtnis-Mechanismus. Sobald sich ein Trend ändert und ein Signal ausgegeben wird, bleibt es bestehen. Keine Neuzeichnung, keine verschwindenden Pfeile und keine Berechnungsfehler beim Durchscrollen der Chart-Historie.
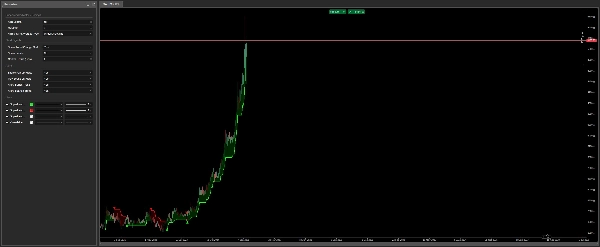
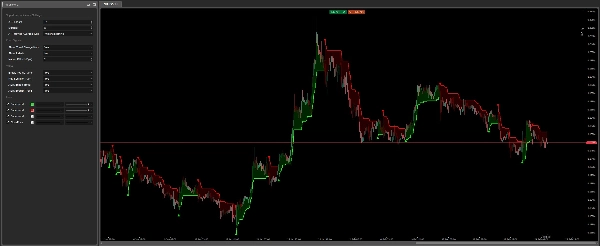
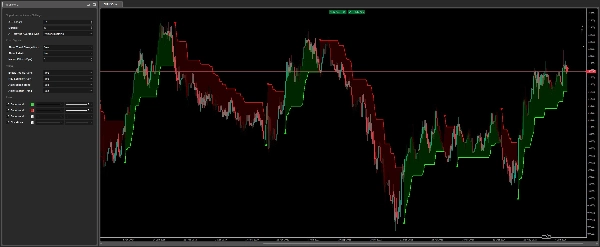
- Einfachheit und Effektivität: Der Indikator zeichnet automatisch eine Supertrend-Linie, die grün wird, wenn der Markt steigt (Kaufsignal), und rot, wenn er fällt (Verkaufssignal). Sie wissen immer genau, in welche Richtung der Trend geht.
- Intelligente Echtzeit-Benachrichtigungen: Verpassen Sie nie eine Handelsgelegenheit! Der Indikator verfügt über ein verbessertes Alarmsystem mit nativen cTrader-Pop-ups und integrierten Soundeffekten. Außerdem werden Sie dank integriertem Spam-Schutz genau einmal benachrichtigt, wenn ein Echtzeit-Signal auftritt – kein nerviger Sound-Spam beim Laden oder Neuladen der Charts.
- Verbesserte visuelle Signale & Cloud-Füllung: Bei jeder wichtigen Trendänderung sehen Sie auffällige Pfeile und optionale "Bullish"/"Bearish"-Textlabels. Eine subtile, dynamische Cloud-Füllung zwischen der Supertrend-Linie und dem Preis hilft Ihnen, die Marktbewegung auf einen Blick leicht zu erfassen.
- Vollständig anpassbar & präzise: Passen Sie Kernparameter wie die ATR-Länge und den Multiplikator einfach an. Sie können auch den Abstand der Pfeile und Labels mit dynamischen, pip-basierten Versätzen präzise steuern, um perfekte, übersichtliche Visualisierungen für jedes Asset zu gewährleisten.
Supertrend-Indikator ist perfekt für alle, die die Marktanalyse vereinfachen möchten – von Anfänger-Tradern, die eine einfache Möglichkeit suchen, Trends zu erkennen, bis hin zu erfahrenen Profis, die hochpräzise, nicht neuzeichnende Signale für ihre Strategien benötigen. Er funktioniert einwandfrei auf jedem Markt – Forex, Aktien, Indizes, Kryptowährungen – und in allen Zeitrahmen.
Zusammenfassung
Kundenbewertungen
5 | 33 % | |
4 | 67 % | |
3 | 0 % | |
2 | 0 % | |
1 | 0 % |


