
Zero Lag LSMA
Indikator
6 käufe
Version 1.0, Aug 2025
Windows, Mac
4.6
Bewertungen: 3
Beschreibung
Der Zero Lag LSMA (Least Squares Moving Average) ist ein hochmoderner technischer Indikator, der für Trader entwickelt wurde, die eine verbesserte Reaktionsfähigkeit und Präzision bei der Trendanalyse suchen. Im Gegensatz zu herkömmlichen gleitenden Durchschnitten, die der Kursentwicklung hinterherhinken, minimiert er die Verzögerung durch Anwendung eines doppelten linearen Regressionsverfahrens, was ihn ideal macht, um Trendrichtungen und potenzielle Umkehrungen in Echtzeit zu erkennen. Dieser Indikator ist perfekt für Forex, Aktien, Rohstoffe und andere Märkte geeignet.
Hauptmerkmale
- Zero-Lag-Leistung: Reduziert die Verzögerung, die bei traditionellen gleitenden Durchschnitten vorhanden ist, und liefert schnellere Signale für Trendwechsel.
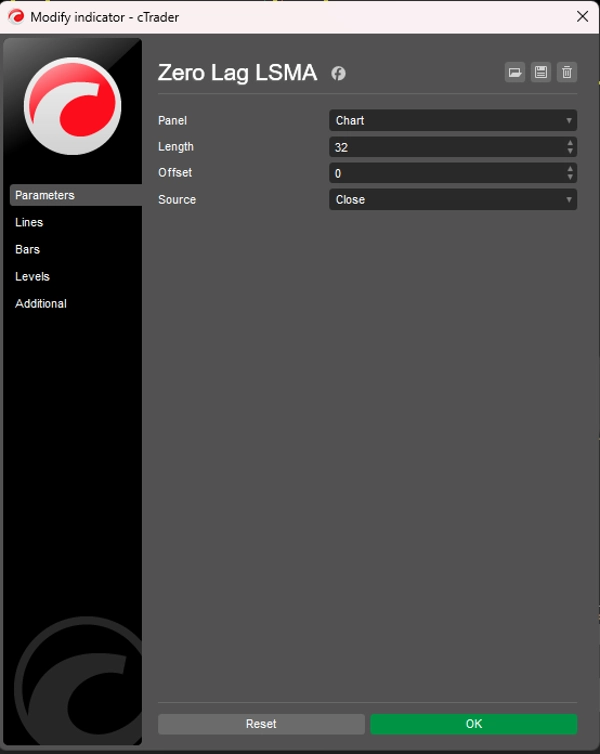
- Anpassbare Parameter: Passen Sie Länge, Versatz und Preisquelle (Open, High, Low, Close) an Ihre Handelsstrategie an.
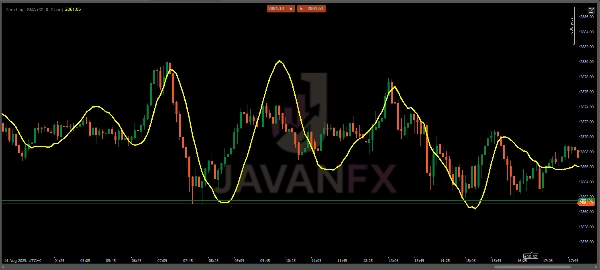
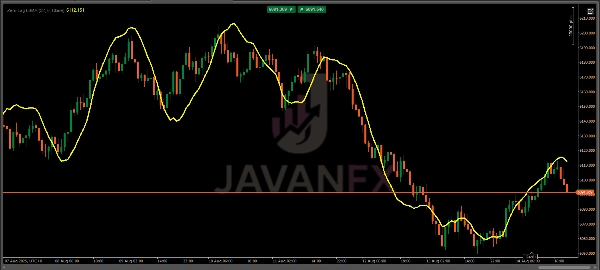
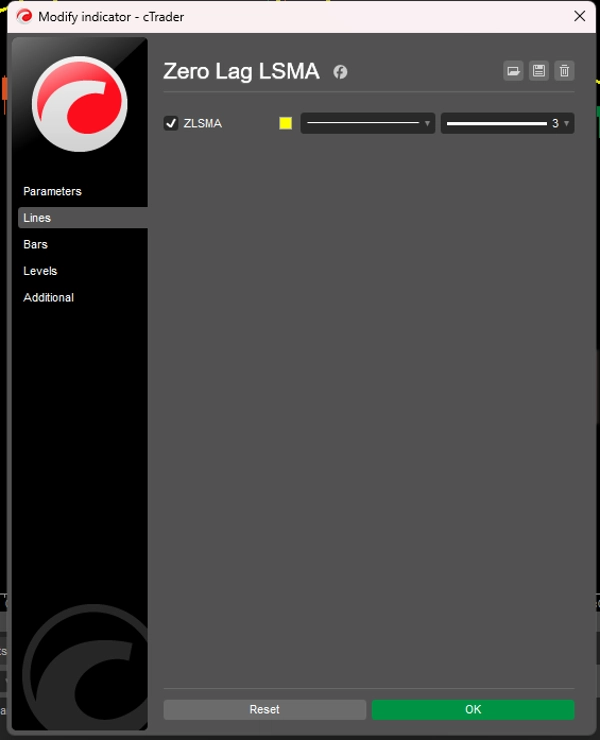
- Visuell intuitiv: Wird als glatte, gelbe Linie über dem Kurschart dargestellt, was die Interpretation erleichtert.
- Vielseitige Anwendung: Geeignet für Scalping, Daytrading, Swing-Trading und langfristige Strategien über verschiedene Zeitrahmen hinweg.
Anwendung
- Trenderkennung:
-
- Wenn die ZLSMA-Linie nach oben geneigt ist, deutet dies auf einen Aufwärtstrend hin.
- Eine Abwärtsneigung weist auf einen Abwärtstrend hin.
- Flache oder unruhige Bewegungen können auf Konsolidierung oder fehlenden Trend hinweisen.
- Ein- und Ausstiegssignale:
-
- Kaufsignal: Gehen Sie eine Long-Position ein, wenn der Kurs die ZLSMA-Linie nach oben durchbricht, insbesondere nach einem bestätigten Aufwärtstrend.
- Verkaufssignal: Gehen Sie eine Short-Position ein, wenn der Kurs die ZLSMA-Linie während eines Abwärtstrends nach unten durchbricht.
- Ausstiegssignal: Ziehen Sie einen Ausstieg in Betracht, wenn der Kurs die ZLSMA-Linie erneut durchbricht oder wenn die Linie sich abflacht, was auf eine mögliche Trendwende hinweist.
- Bestätigung:
-
- Kombinieren Sie ZLSMA mit anderen Indikatoren (z. B. RSI, MACD) oder Unterstützungs-/Widerstandsniveaus, um Signale zu bestätigen und Fehlausbrüche zu vermeiden.
- Verwenden Sie höhere Zeitrahmen (H1, H4, D1) für stärkere Trendsignale oder niedrigere Zeitrahmen (M5, M15) für Scalping.
Handelsstrategien
- Trendfolge: Nutzen Sie ZLSMA, um starke Trends zu reiten, indem Sie bei Rücksetzern zur ZLSMA-Linie in Trendrichtung einsteigen.
- Umkehrhandel: Achten Sie auf Kursdivergenzen von der ZLSMA-Linie in Kombination mit Kerzenmustern (z. B. Pin Bars, Engulfing Candles) für Umkehr-Setups.
- Breakout-Handel: Beobachten Sie Kursausbrüche über/unter der ZLSMA während Phasen hoher Volatilität für potenzielle Einstiegspunkte.
Tipps für optimale Nutzung
- Länge an Marktbedingungen anpassen: Verwenden Sie eine kürzere Länge (z. B. 10-20) für schnellere Märkte oder Scalping und eine längere Länge (z. B. 50-100) für glattere Trends in höheren Zeitrahmen.
- Testen Sie auf Demokonto: Bevor Sie den ZLSMA im Live-Handel einsetzen, testen Sie ihn auf einem Demokonto, um sein Verhalten in Ihren bevorzugten Märkten zu verstehen.
- Vermeiden Sie Überhandel in unruhigen Märkten: ZLSMA funktioniert am besten in Trendmärkten; verwenden Sie zusätzliche Filter (z. B. ADX), um Fehlsignale in Seitwärtsmärkten zu vermeiden.
Zusammenfassung
KI-Zusammenfassung
The Zero Lag LSMA (Least Squares Moving Average) is a technical indicator designed to enhance trend analysis by minimizing the lag typical of traditional moving averages. It uses a double linear regression process to provide faster and more responsive signals, making it suitable for real-time identification of trend direction and potential reversals. The indicator is applicable across various markets including forex, stocks, and commodities.
Key features include customizable parameters such as length, offset, and price source (Open, High, Low, Close), allowing adaptation to different trading strategies. It displays as a smooth yellow line overlaid on the price chart for clear visual interpretation. The indicator supports multiple trading styles and timeframes, from scalping to long-term strategies.
Traders use the Zero Lag LSMA to identify trends by observing the slope of the line: upward for bullish trends, downward for bearish, and flat for consolidation. Entry and exit signals are generated when price crosses the LSMA line, with additional confirmation recommended through other indicators or support/resistance levels. The indicator supports trend following, reversal, and breakout trading strategies, with adjustable settings to optimize performance under varying market conditions.
Indikatorprofil
Kundenbewertungen
4.6
Bewertungen: 3
5 | 67 % | |
4 | 33 % | |
3 | 0 % | |
2 | 0 % | |
1 | 0 % |
Kundenbewertungen
October 10, 2025
Zero lag, full clarity ⚡ LSMA tracks price action like a scalpel — sharp, fast, and smooth. Great trend filter for any timeframe!
August 27, 2025
The only reason it stays interesting is the setup needs less second guessing. A normal demo run is enough to see the weak spots.
August 16, 2025
Not bad if the rules are already clear. Spread and slippage need a line in the notes.
Diskussion
Häufig gestellte Fragen (FAQ)
Über den cTrader Store verfügbare Produkte, einschließlich Handelsbots, Indikatoren und Plugins, werden von externen Entwicklern bereitgestellt und nur zu Informations- und technischen Zugriffszwecken verfügbar gemacht. cTrader Store ist kein Broker und erbringt keine Anlageberatung, persönlichen Empfehlungen oder eine Garantie für zukünftige Performance.


Preis
Seit 14/07/2025
60
Verkäufe